AIC Marketing Inventory System Management Capstone Project Document
Introduction
Technological evolution has paved the way for our modern state of living. That has been essential to the change in people’s way of seeing and working in his environment. This so likewise spurred much further to the desire Inventory System is popularly used in many firms because of a case in monitoring the in and outflow of the products. Inventory Systems also provides complete information about the number of product specification details and corresponding prices. This information allows the AIC administrator to make better marketing decisions. On where to re-order or re-stock, upgrade stock specification, terminate or cease product type, change supplier, and many other actions. Or devices of developing systems more tools to enjoy, and that simplifies this job.
Background of the Study
AIC Marketing sells various hardware, electrical, and safety supplies; its business address is located at Lopez Jaena between Burgos and Galo Street Bacolod City. AIC Marketing owned and managed by Alfred Joseph Valencia Nuńez, who is both a dealer and distributor of construction products.
AIC Marketing is doing the Inventory of their products manually taking many periods of time which could be used doing other productive tasks. This circumstance helped the group to realize the firm’s need for an automated Inventory System. With it, it is viewed that the said system would eliminate tedious and manual Inventory of products.
Statement of the Objective
Specifically, this system study aims to develop a functional Inventory System that has the following functionalities.
- Allows adding, editing, updating products, product specification, and corresponding prices.
- Allows monitoring of stocks within and outflow, and remaining stock balance.
- Allows recording of supplier and customer information.
- Integrates point-of-sale to the system.
- Generates sales and Inventory reports.
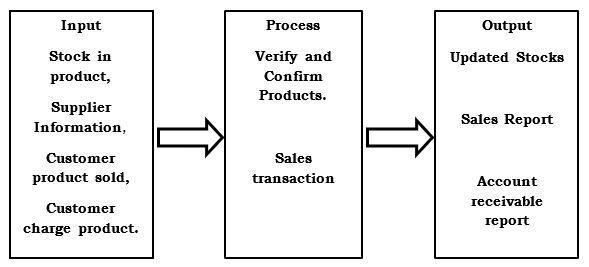
Conceptual Framework
The purpose of this system is to convert the manual process of inventory into an automated system.
Conceptual Framework
Scope and Delimitation Study
This system has the following scope and limitations:
Scope
- Only the administrator can access the whole system.
- Only the cashier can create a sales transaction
- The system is used for LOCAL AREA NETWORK (LAN)
Delimitation
- It’s not designed for an online environment/flatform
- Cannot be accessed by the customer
Significance of the study
The study will be significant to the following identified beneficiaries:
Administrator – The admin can check and update the stocks within the comfort of his office without hassle.
Cashier – This is significant to AIC Cashier because she/ he can generate reports of the purchases of products or sales.
Future Researcher – This study may help future researchers with similar education and use it as a reference.
Definition of Terms
Inventory operationally– it refers to a record containing all purchase products from suppliers and sold products to a customer.
Conceptually – This study uses the same operational definition.
Brand – a type of product manufactured by a particular company under a specific name.
Category – a division of people or things regarded as having particular shared characteristics.
Product – an article or substance that is manufactured or refined for sale.
User – a person who uses or operates something, especially a computer or other machine.
Customers – a person or organization that buys goods or services from a store or business.
Suppliers – a person that provides something needed, such as a product or service.
Stock – is a general term used to describe the ownership certificates of any company. A share, on the other hand, refers to the stock certificate of a particular company.
Inventory – a complete list of items such as property, goods in stock, or the contents of a building.
Review of Related Literature
This chapter presents ideas and research associated with the system.
Local Related Studies
Global RFID Medical Inventory Management Systems
Global RFID Medical Inventory Management Systems Market Research Report 2017 incorporates historical knowledge that spans 2012 to 2016, after which it continues to forecast to 2022. That makes this report so invaluable, sources, to its leaders in addition to the brand new entrants within the trade.
NetSuite Administration Retail Stock
NetSuite is a cloud-based multi-channel retail administration resolution for retailers that mix e-commerce, POS, and order administration functionalities. The software program supplies a unified retail system with again workplace administration to promote the merchandise on several channels throughout several areas and nations. The appliance understands the complexities of the retail mannequin, the software program, and necessities, and permits retailers to concentrate on prospects. NetSuite for Retail permits retailers to configure the applying as per their wants. Retailers can add new channels, geographies, enterprise fashions, and types. The software program supplies real-time insights into buyer conduct, gross sales, stock, and financials. The order administration system permits retailers to run “purchase wherever,” “fulfill wherever,” and “return wherever” performance. The software program has an exercise dashboard that gives weekly or month-to-month gross sales studies for retailer managers, stock managers, e-commerce managers, and executives. The software program has the power to change and add new capabilities into the system because the retailer enterprise grows and expands into new segments.
Foreign Related Studies
Stock Management System
An inventory control system is a system the encompasses all facets of managing an organization’s inventories; buying, transport, receiving, monitoring, warehousing and storage, turnover, and reordering. In several companies, the actions related to every one of those areas is probably not strictly contained inside separate subsystems. However, these capabilities should be carried out in sequence to have a well-run stock management system. Computerized stock management techniques make it potential to combine the different useful subsystems, which can be part of the stock administration right into a single cohesive system. Matas is operating standard weighted costing with Stock II on Ax2009.
The GEA Group is likely one of the largest system suppliers for meals and power processes, with EUR 5.four billion in income in 2011. GEA carried out Stock-II in 2010 with the primary function of having the ability to manage and preserve merchandise reservations in a versatile and clever manner. Additional, the Actual-time costing method featured by Stock-II ensures correct costing at any cut-off date.
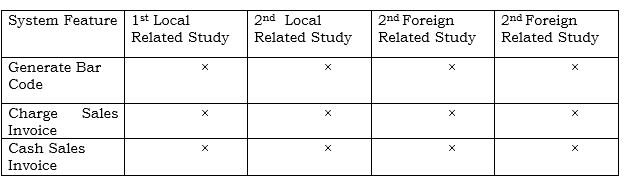
Associated System Abstract Desk
This desk exhibits the options of our system based mostly on the researcher evaluation within the comparability of an associated system in line with AIC Advertising Stock System
Related System Summary Table
Related System Summary Table
This table shows the features of our system based on the researcher analysis in the comparison of related systems according to the AIC Marketing Inventory System Management.
Synthesis
The system that’s within the associated research, each native and international techniques. Has a function that was current is related. For native associated examine, the software program has an exercise dashboard that gives weekly or month-to-month gross sales studies for retailer managers, stock managers, and for the foreign-related examine, A listing management system is a system the encompasses all facets of managing an organization’s inventories; buying, transport, receiving, monitoring, warehousing and storage, turnover, and reordering.
Methodology
This chapter shows the methods architectural structures and diagram, hardware and software requiremenst considered for the system.
The proponents followed the Incremental Waterfall Model, one of the models in System Development Life Cycle (SDLC). This model is their guide to make the system feasible. The different Phases involve Planning, Analysis, Design and Implementation. The phases where done correctly to ensure the objective of the proposed system is achieve.
Design Phase
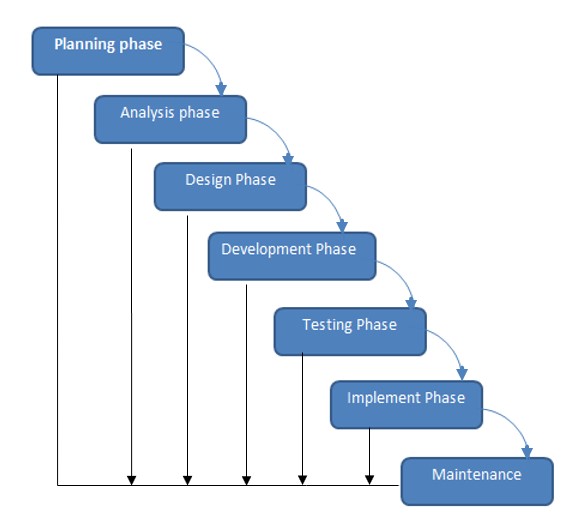
Incremental Waterfall Model
Planning Phase
This is second phase in the project life cycle. It involves creating of a set of plans to help guide the team through the execution and closure phases of the project.
Analysis Phase
Is where you break down the deliverables in the high-level Project Charter into the more detailed business requirements. The Analysis Phase is also the part of the project where you identify the overall direction that the project will take through the creation of the project strategy documents.
Design Phase
This is the phase of system designing. It is the most crucial phase in the development of a system. The logical system design arrived at as a result of system analysis and is converted into physical system design
Development Phase
During this phase, systems are developed or acquired based on detailed design specifications. The system is validated through a sequence of unit, integration, performance, system, and acceptance testing. The objective is to ensure that the system functions as expected and that sponsor’s requirements are satisfied.
Testing Phase
The software development lifecycle (SDLC) is where you focus on investigation and discovery. During the testing phase, developers find out whether their code and programming are work according to customer requirements. And while it’s not possible to solve all the failures you might find during the testing phase, it is possible to use the results from this phase to reduce the number of errors within the software program.
Implementation Phase
The project team creates the actual product. Product implementation can be an exciting phase for the customer, because their idea for the project becomes something tangible. Project developers begin building and coding the software.
Maintenance Phase
The system is scheduled for maintenance every 8 months. This has been explained to the firm’s administrator and management.
User’s Acceptance Survey
The value users acceptance survey is standardized instrument that intends to help evaluation satisfaction of the system administrator and others selected voters evaluators.
Operational Feasibility
The AIC Marketing found difficulties in monitoring their stocks an automated physically checking their stock since they since they do not have have an automated Inventory System to lessen the time on checking and updating their stock or products. Through the develop of Inventory System the works would efficiently checked and monitored as to its availability and re-stocking, and other inherent features in an inventory system has The instrument four(4) categories & referring to effectiveness, efficiency, quality, timeliness, and productivity of the system.
Participant- respondents of the survey are made to rate using 1 to 5 options, each corresponds to degree of satisfaction.Below shows the numerical and verbal equivalents
1—-Low
2—-Very Low
3—-Moderate
4—-High
5—-Very High
Program Environment
Front End
HTML is the standard markup language for creating web pages and web applications. With Cascading Style Sheets (CSS), and JavaScript, it forms a triad of cornerstone technologies for the Worldwide Web. Web browsers receive HTML documents from a web server or from local storage and render them into multimedia web pages. HTML describes the structure of a web page semantically and originally included cues for the appearance of the document.
CSS is designed primarily to enable the separation of presentation and content, including aspects such as the layout, colors, and fonts. This separation can improve content accessibility, provide more flexibility and control in the specification of presentation characteristics, enable multiple HTML pages to share formatting by specifying the relevant CSS in a separate .css file, and reduce complexity and repetition in the structural content.
Back End
PHP code may be embedded into HTML or HTML5 markup, or it can be used in combination with various web template systems, web content management systems and web frameworks. PHP code is usually processed by a PHP interpreter implemented as a module in the web server or as a Common Gateway Interface (CGI) executable. The web server software combines the results of the interpreted and executed PHP code, which may be any type of data, including images, with the generated web page. PHP code may also be executed with a command-line interface (CLI) and can be used to implement standalone graphical applications
MySQL is a central component of the LAMP open-source web application software stack (and other “AMP” stacks). LAMP is an acronym for “Linux, Apache, MySQL, Perl/PHP/Python”. Applications that use the MySQL database include: TYPO3, MODx, Joomla, WordPress, phpBB, MyBB, and Drupal. MySQL is also used in many high-profile, large-scale websites, including Google (though not for searches), Facebook, Twitter,Flickr, and YouTube.
Technical Feasibility
Hardware specification (maximum requirement)
Server
- Dual Core Processor
- 4GB Ram (internal Memory)
- 1000 Gb Hard drive
Software specification (maximum requirement)
Server
- XAMPP
System Architecture
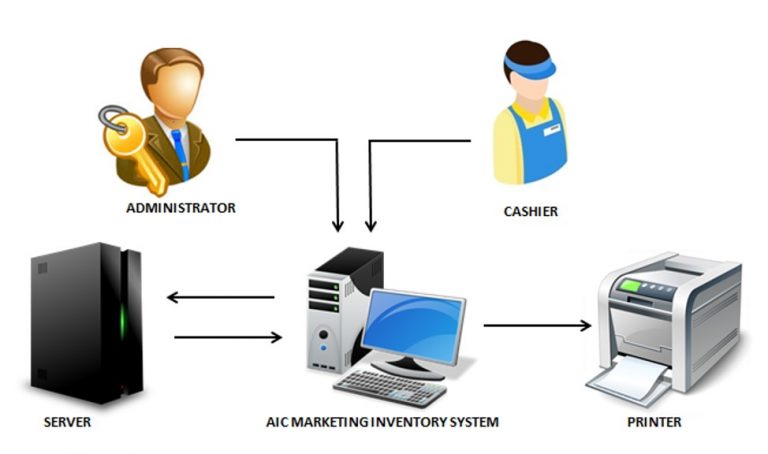
System Architecture
The AIC Marketing Inventory System shows the network design for the administrator for the cashier.
Feasibility Schedule
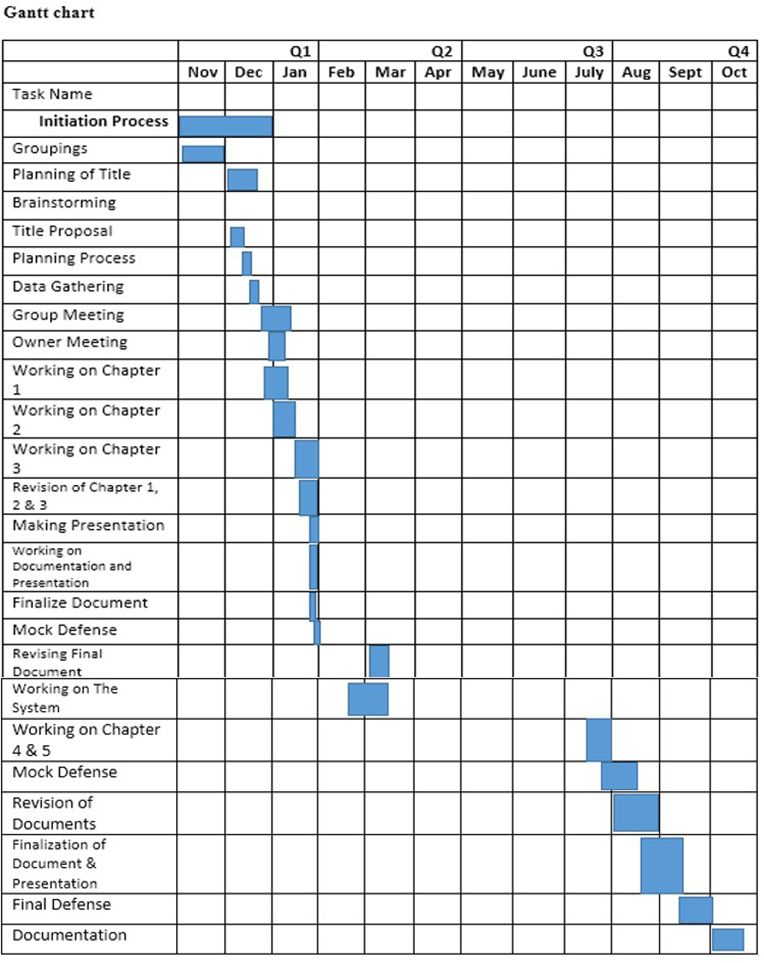
Gannt Chart
This chart shows the schedule of the activities and the amount of time undertaken by team
Cost Benefit Analysis
Cost Benefits Analysis or CBA is the estimation and total equivalent money value of the benefits and costs of the system in order to determine its worth.0
Table 2.0: Developmental Cost
Developmental Cost Duration Monthly Cost Total Amount
Programmer 8months Php 10,000.00 Php 80,000.00
System Analyst 8months 9,000.00 72,000.00
Project Manager 8months 9,500.00 76,000.00
Electricity 8months 300.00 2,400.00
TOTAL Php 230,400.00
The Developmental Cost of the system shows on this table. Developmental cost includes the details for system analys and project manager’s estimated professional fees and the costs is relating to utility expense.
Table 2.1: Operational Cost
Operational Cost Duration Monthly Cost Total Amount
Electricity 15 months Php 750.00 11,250.00
Maintenance 15 months 2,000.00 30,000.00
TOTAL Php 41,250.00
Operation cost is show on this table. This operational cost includes the electrical consumption cost and the maintenance cost in a year.
Table 2.2: Total Developmental and Operational Cost
TOTAL AMOUNT
Total Development Cost 230,400.00
Total Operational Cost 41,250.00
TOTAL Php 271,650.00
This table shows overall total cost of development and operation of the system.
Table 2.3: Benefits of the System
Benefits of the System (Annually) Amount/Value
Efficiency of work/output of Volunteer Php 30,500.00
Security of Data 6,500.00
Work Management of the Volunteer 33,000.00
TOTAL Php 70,000.00
Total benefits of the system to the AIC Marketing Inventory System in showns on this table.
Table 2.4: Cost Benefit Analysis
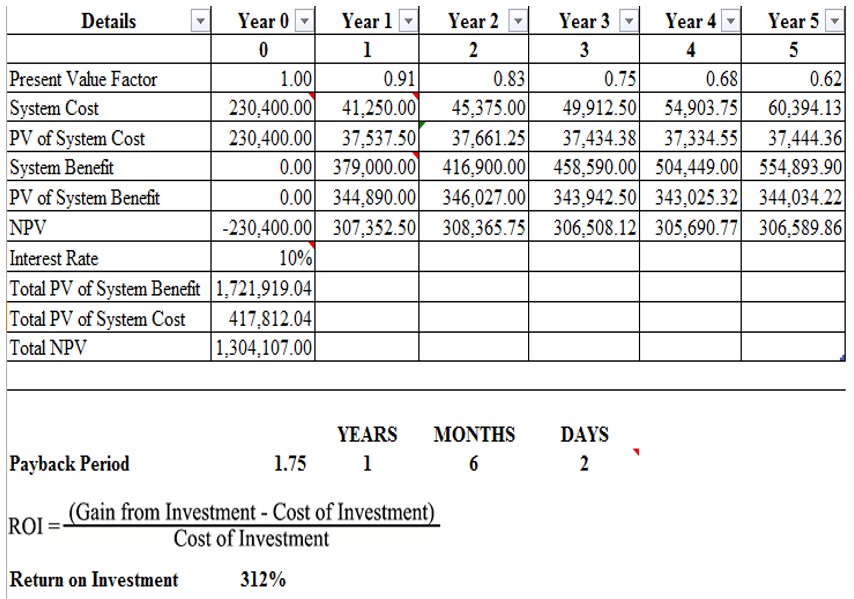
Cost Benefit Analysis
Database Model
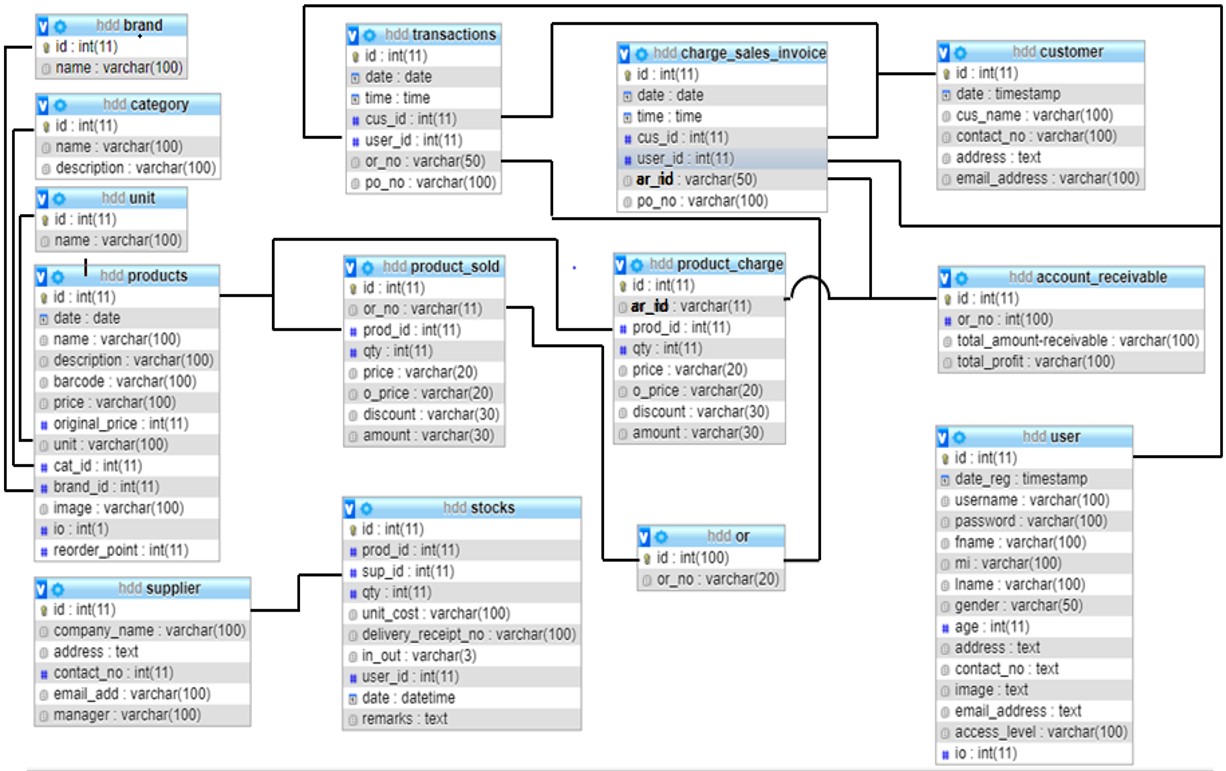
Database Model
This figure shows the relationship of each entity. The data gathered into individual entities were used as base for the record and entitiesand the necessary attributes that simplify the data in the system.
Data Flow Diagram
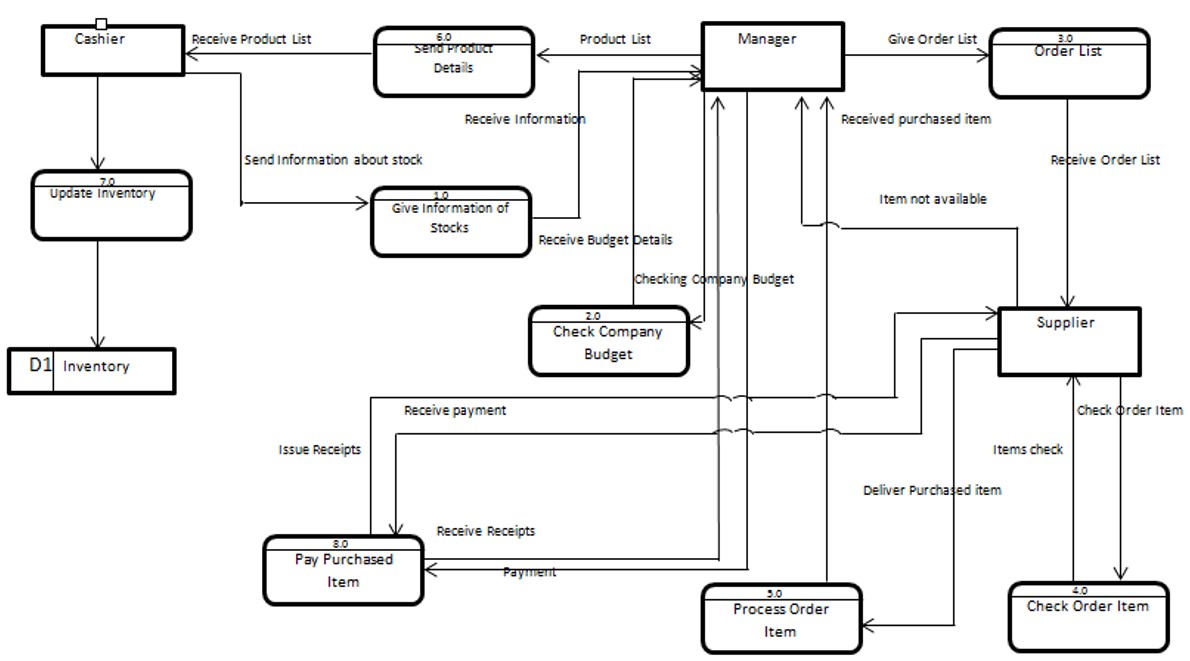
Data Flow Diagram
This data flow diagram shows the process between the admin and the customer.
Data Dictionary
Table 3.0: Data Dictionary of the System
Data field Type Description Brand
Id int(11) Id number of Brand
Name varchar(100) Name of brand
| Data field | Type | Description |
| Category | ||
| Id
Name Description |
int(11)
varchar(100) varchar(100) |
Id number of category.
Refers to the name of category. Refers to the description of category. |
| Unit | ||
| Id
Name |
int(11)
varchar(100) |
Id number of unit.
Refers to the name of the unit. |
| Products | ||
| Id
Date Name Description Barcode Price Original_price Unit Cat_id Brand_id Image Reorder_point |
int(11)
date varchar(100) varchar(100) varchar(100) varchar(100) int(11) varchar(100) int(11) int(11) varchar(100) int(11) |
Refers to the id number of products.
Refers to the date. Refers to the name of the product. Refers to the description of products. Refers to the barcode of product. Refers price of the product. Refers to the original price of product. Refers of the unit of the product. Category id of product. Brand id of product. Refers to the image of the product. Reorder point of product . |
| Supplier | ||
| Id
Company_name Address Contact_no Email_add Manager |
int(11)
varchar(100) text int(11) varchar(100) varchar(100) |
Id number of the supplier.
Refers to the company name of the supplier. Address of the supplier. Contack number of supplier. Email add of the supplier. Refers to the manager of the supplier. |
| Transaction | ||
| Id
Date Time Cus_id User_id Or_no Po_no |
int(11)
date time int(11) int(11) varchar(100) varchar(100) |
Id number of transaction.
Refers to date of transaction. Refers to time of transaction. Customer number of transaction. User number of transaction. Refers to the official receipt of transaction. Refers to the Purchas order number. |
| Product_sold | ||
| Id
Or_no Prod_id Qty Price O_price Discount Amount |
int(11)
varchar(11) int(11) int(11) varchar(20) varchar(20) varchar(30) varchar(30) |
Id number of product sold.
Official receipt number of product sold. Refers to product number of product sold. Refers to quantity of product sold. Price of the product sold. Refers to the original price of product sold. Refers to the discount of product sold. Refers to the amount. |
| Stock | ||
| Id
Prod_id Sup_id Qty Unit_cost Delivery_receipt_no In_out User_id Remarks |
int(11)
int(11) int(11) int(11) varchar(100) varchar(100) varchar(3) int(11) datetime text |
Id Stock number.
Product number of stock. Supplier number of stock. Quantity of stock. Unit cost of stock. Delivery receipt number of stock. In out of stock. User number of stock. Date. Remarks of stock. |
| Charge_sales_invoice | ||
| Id
Date Time Cus_id User_id Ar_id Po_no |
int(11)
date time int(11) int(11) varchar(50) varchar(100) |
Charge sale invoice number.
Date. Time of charge sale invoice. Refers Customer number. User number of charge sale invoice. Account receivable of charge sale invoice. Refers to the Purchas order number. |
| Product_charge | ||
| Id
Ar_id Prod_id Qty Price O_price Discount Amount |
int(11)
varchar(11) int(11) int(11) varchar(20) varchar(30) varchar(30) varchar(30) |
Id number of product charge.
Account receivable number. Refers to Product number. Refers to the quantity. Price of product charge. Original price of product charge. Discount of product charge. Amount of product charge. |
| Or | ||
| Id
Or_no |
int(100)
varchar(20) |
Official receipt number.
Official receipt number. |
| Customer | ||
| Id
Date Cus_name Contact_no Address Email_address |
int(11)
timestamp varchar(100) varchar(100) text varchar(100) |
Customer number.
Date. Refers to the customer name. Contact number of customer. Address of customer. Email address of customer. |
| Account_receivable | ||
| Id
Or_no Total_amount-receivable Total_profit |
int(11)
int(100 varchar(100) varchar(100) |
Account receivable number.
Official receipt number. Refers to Total amount-receivable. Total profit of Account receivable. |
| User | ||
| Id
Date_reg Username Password Fname Mi Lname Gender Age Address Contact_no Image Email_address Access_level Io |
int(11)
timestamp varchar(100) vachar(100) varchar(100) varchar(100) varchar(100) varchar(50) int(11) text text text text varchar(100) int(11) |
User number.
Date register of user. Refers to the username. Refers to the password. Full name of user. Middle initial of user. Last name of user. Gender of user. Age of user. Address of user. Contact number of user. Image of user. Email address of user. Refers Access lever of user. In out of user. |
Presentation, Analysis, and Presentation of Data
This chapter presents results of the User’s Survey conducted for the system.
Presentation
The researchers demonstrated the system’s functionality to the randomly selected respondents, the researcher observed how the respondents responded and operated the system. Moreover, User’s through the Acceptance Survey, the selected participant-respondents were made to evaluate the system on fives categories: effectiveness, eefficiency, timeliness, quality, and productivity.
Data Analysis
After the administration of the user’s acceptance survey , responses were tallied with reference to the level of experienced satisfaction, utilizing the scale from 1 to 5. The said scale corresponded to verbal interpretations shown below. Further, this tally was finally used to obtain mean.
Scale:
5— Verbal Interpretation
4— Very High
3— Moderate
2— Low
1— Very Low
Characteristics of the Respondents
The participant-respondents of the system evaluation were the admin, cashier and the customer.
There were one (1) administrator, one (1) cashier, and twenty eight (28) customers during evaluation.
Table 4.0 Frequency of Respondents
| Respondents | Frequency |
| administrator
cashier customer Total |
1
1 28 30 |
Table 4 shows the frequency or number of the participant-respondents for the system evaluation.
Interpretation of Data
The instrument helped evaluate the user’s satisfaction of the users in terms (5) categories system in terms of it: effectiveness, efficiency, auality, timeless and productivity.
The instrument is divided into these categories the first category is composed of four (4) items, second category has number of items under each of three (3) items, third category has of four(4) items, and then the fourth and fifth category have of four(4) items each.
Table 5.0 Rating Scale
Range of Mean Verbal Interpretation
4.21-5.00 Very Satisfied
3.41-4.20 Satisfied
2.61-3.40 Neutral
1.81-2.60 Dissatisfied
1.00-1.80 Very Dissatisfied
This table shows the range of mean and its corresponding verbal interpretation.
Table 6.0 Survey Result of Effectiveness
Effectiveness
Question 1 Question 2 Question 3 Question 4 TOTAL
Mean 3.7 4 3.7 3.9 3.825
Table 6.0 reveal that effectiveness of the system, obtaining mean of 3.825, is very high.
Table 6.1 Survey Result for Efficiency
Efficiency
Question 1 Question 2 Question 3 TOTAL
Mean 4.133 4.033 4.5 4.222
Table 6.2 Survey Result Quality
Quality
Question 1 Question 2 Question 3 Question 4 TOTAL
Mean 4 4.2 4.266 4.166 4.158
This table shows the survey result for the systems quality recorded a total mean of 4.158which is interpreted that the users were satisfied with the systems quality after using it.
Table 6.3 Survey Result Timeliness
Timeliness
Question 1 Question 2 Question 3 Question 4 TOTAL
Mean 4.166 4.333 4.333 3.366 4.291
This table shows the survey result for the systems timeliness accounted a total mean of 4.291 which is interpreted that the user were very satisfied with the efficiency of the system aster testing it.
Table 6.4 Survey Result Productivity
Productivity
Question 1 Question 2 Question 3 Question 4 TOTAL
Mean 4.5 4.6 4.633 4.533 4.566
This table shows the survey result for the systems productivity as a whole has an average of 4.566 which is interpreted that the user were very high satisfied with the systems productivity after testing it.
Summary of Findings, Conclusion and Recommendation
This chapter presents the summary of findings recommendations and conclusions based on system evaluation.
Summary of Findings
The findings reveal that the system satisfaction of the system evaluators as to effectiveness was very high; as to efficiency,high ; as to qulity; and as to tindinum high;and as to productivity, very high.
Effectiveness —–VH
Efficiency——H
Quality—–H
Timeliness—–H
Productivity——VH
Conclusion
Based on the result of the survey and feedback gathered, the researchers conclude that it would be helpful for the company to use the system because it can assist management of monitor inventories, profit and the Status of products. It further concludes that the system is deployable and can stably perform its intended purpose.
Recommendation
With reference to the result of the survey and conclusions drawn, it is recommended that the system is readily deployable and functional; functionalities on its efficiency quality and timeliness may be further enchance.For this, maintenance is moreover recommended to gradually work out this aspects.This the regular 6months maintenance should be observed.


Leave A Comment
You must be logged in to post a comment.