School Management System Capstone Project Document
Introduction
Can you imagine the schools without management structures? Your body without skeletons? Definitely we are living in this world with levels of patterns. It’s a process to achieve the management goals. School is one of the schools that applies management, to run the school systematically. To further recognize qualifications to leverage the talents and abilities of the students
According to Paul Harmon (2001), Management is the art of getting things done through people. The basic management functions involved POLC, planning, organizing, leading and controlling. You’ll carry out project work in the society, compete in other schools and take part in all levels of competition by division, regional and national levels. Management leads us to achieve goals. (Paul Harmon 2001) The school aim to reach the level of what they aimed for from the schools mission and vision. The school provides a forum for parents, teachers, students, community stakeholders and the school head to work together towards continuously improving students learning outcomes. For the school beautification it always depends. Financially on the amount resources of funds for each improvement areas. To strengthen further the ability of this school is to teach the students in an effective way we can see it in their grades, attitudes and the way they act around their organization. To achieve the best Education. ABC Company is school governance which needed strategic decisions that shape the schools and its works. The school always plan, initiates, manages, supports, monitors, evaluate and implements school related activities in order to better achieve the goals of education.
Management is indeed needed for school communities. It was things started for getting things right. It further develops the changes reveals that one must do with its flow. It is along these above cited reasons that a study of this nature was conducted. Through the given conditions of the school, the proponents will design and develop a management system for LHNHS.
Background of the Study
School teaches students in grades seventh through tenth in Bacolod City, Negros Occidental of Western Visayas (Region VI). The school has 38 instructional rooms and 12 non-instructional rooms, which are all powered by a power grid. With 1,640 students, class size is around 43 students. Mrs. Maricon Rosa real is the in charge of the school, acting as the school’s principal.
For the 2013-14 school 2013-2014. ABC Company had 1,640 students enrolled. This makes the school a big school, with 1,390 more students than the average school and 324 more students than the average school. in Bacolod City. The school has an almost equal number of male and female students. This is unlike the average gender breakdown in Bacolod City, which sees on average 0.9 female students per male. ABC Company has a total of 50 rooms – 38 of which are for instructional purposes and the remaining 12 for non-instructional uses. All in all, the school has at least one canteen, clinic, computer lab, general academic classroom, home economics,
Industrial/workshop, laboratory, library, and office. Of the instructional rooms, all of them are standard rooms, meaning they meet the DepEd’s guidelines for safety and usability.
With 1,640 students and 38 rooms actively used for teaching, ABC Company has an average class size of 43. This puts ABC Company’ classes on the larger side, as the school has 8 more students per class than the average of all schools, and about the average number (43) of students per class compared to the rest of class sizes in Bacolod City, Negros Occidental. Currently, ABC Company’ does not have a system. Some of the students don’t know their section and, the new students do not know the event at their school. So they decided that the proponents will make them a system. Some of the students don’t know their section and, the new students do not know the event at their school. So they decided that the proponents will make them a system that responds to their needs. Also, to make their works easily, to enroll more students and to reduce their workload. Requests of personal data that relates student’s records and many others. These records contain information that should be preserve. These records should as well be kept in a secured place away from alterations and loss. Difficulty of updating and retrieving the records of the student.
Objectives of the study:
This study aims to develop a system for SCHOOL to help in securing data, registration of student, viewing of student profile.
Specifically, the study aims to:
- Design and develop an enrolment system for LHNHS that will:
- Manage LRN of every student.
- Allow the teacher to monitor the list of enrolled students, schedule of events and activities.
- Create database for convenient way of encoding storing, tracking of student’s record.
-
- Provide accurate data of the student.
- Evaluate the LNHHS Enrolment system according to ISO-9126 standard.
Conceptual Framework
The conceptual framework of School is to show the enrolment system flow that helps to identify the enrolee’s information whether it is transferee or old students, Collect the enrolees information, then the information will be given to their designated year and section to be recorded. Then copy the enrolment form and it will be given to their designated year and section. And lastly the student is officially enrolled.
| INPUT | PROCESS | OUTPUT |
| Enrollment of students
Promote student Schedule of events and activities. |
Verifying the enrollment of the students
Student information Allowing them to see or view the upcoming schedule of events and activities. |
SCHOOL MANAGEMENT SYSTEM
. |
Figure 1 shows the enrollment flows that helps to identify the enrollees whether it is transferee or old student, Collect enrollee’s information, then the information will be given to designated year and section to be recorded. Then copy the enrolment form and it will be given to their designated year and section. And lastly the student is officially enrolled.
Scope and Delimitation
The system School Management System (LHNHSMS) can only be access by enrollment staff and teachers.
Scope
This study covers the School. This study allows the Office-in-charge and the school head to enroll students, view, record, save and submit data regarding the status of the student.
The Office-in-charge is allowed to register students, view student information and update student records by promoting student to another class level.
Delimitation
The study is limited to the registrar, the school head of School and the parents of the students. This study does not display the class schedule of the student and it is not applicable for online. Only authorized personnel can access the system.
Significance of the Study
The present study is significant to the following persons foremost of which are as follows.
SCHOOL
The findings of the study will serve as guide to continue their unconditional support to the students which can help or assist the problems of the School students to enhance their educational system.
Admin. This study will benefit the Admin knowing that he can use an automated system in viewing students` information and payment data. He can also add easily the staff that will access the system.
Students. This study will benefit the student because they can benefit from the information that they gave to the teachers. If calamity happens because their file is secured and they will have the back up of it.
School. This study will benefit to the school in way that the school can have access over the records and files of the student with problem in absences, in grades, in behavior.
Teacher. This study will benefit to the teacher that they can use automated system in registering students. This system will also provide a secure way of storing student’s information.
Future researcher. This study will beneficial to them in a way that this can serve as their guide for registration and information system and other similar system that they will encounter.
Definition of Terms
Administration: Conceptually, It means a group of people who manage the way a company, school, or other organization functions. (Miriam Webster, n.d.)
Operationally, it means as used in the study, it is an organization that is part of the institution.
Automated System: Conceptually, It refers to the method used to increase production and reduce cost. (Reference, n.d.)
Operationally: it refers to use in the study it is a system designed to convert manual process in the use of registering or storing files.
Enrollment: Conceptually, it means to insert register or enter in a list catalog or roll. (Merriam Webster. N.d.)
Operationally: it means as used in the study it is the process of registering student, generate assessment and payment of the student.
Files: Conceptually, it means a device (as a folder, case or cabinet) by means of witch papers are kept in order. (Merriam Webster. n.d.)
Operationally: it refers to the record of a complete collection of data. Someone to do a specific task or practice.
Students Record: Conceptually, according to the University of Santa Cruz, Records directly related to a student’s personal records. (University of California Santa Cruz)
Operationally, it is student personal information.
Review of Related Literature
This chapter presents different compilations of related topics and studies that are relevant to profiling and enrollment system
Foreign Related Literature/System
Smith College Records Management System
Storage of records has always been a fundamental objective of information system however in the past decade managing sensitive information throughout, its lifer cycle from creation to destruction (or archival), has become of significant importance. The increasing awareness of the impact technology on privacy added momentum to the need to have better enforcement of records retention policies Organization today not only have to comply with regulations, but also have to maintain a balance between operational record keeping requirements minimizing liability of strong private information, and costumer privacy preference. This work will not attempt to define the term “record” in the broad context. Instead the term will be treated in all its generality and then applied to the world of relational databases. Without attempting to differentiate terms such as data, knowledge, information and record, it is recommended that the reader maintain a simple but consistent definition of a record throughout this thesis. (Dandeleon, 2012).
Jiwaji University Management System
It puts forward the design principle and goal of university administrative management system and elaborates on the design of function modules of its major subsystems. We mainly study the functional design of three major modules, user authentication module, announcement management module and official document management module. On the basis of analyzing various data mining model and algorithm, data mining model is put forward for educational decision support system. In addition, we introduce the scheme of security design. This system performance is better, and the function has achieved the desired goal. (Deng Xu, 2016)
Student Information and Record System
This study develops a system that focuses mainly on student information and record system. This study created a database that provides update records for primary updates done with regards to student’s information and registrar’s reports, this include updates to student information and grades. Additionally, this system is capable to handle and generate printed copies of registrar’s primary reports sent to CHED and ABC main campus. Furthermore, this system is limited to storage and generation of student’s grades and registrar’s reports only. Thus reports that are not usually or normally requested for the Registrar to provide or issue are not included into the system as well. The student information and record system can store and provide the needed information in a faster and more convenient way by storing file of the students’ records in a computer system. (Lincoln Eman I. Moguies, 2012).
Happy Tots Enrolment System
Enrolment System is a good example of a computer generated process. This can lessen the work load and provides accurate information needed by the school. As a result, it will benefit not only the student’s but the administration of a whole. The idea behind the Enrolment System is not new concept. As a student enrollees increase every year, enrollment procedure become harder to deal. This will only serve to increase the problem facing enrollment that provides more easy way in enrolling. Enrolment system is very essential in a school. By applying this system Enrollment system will provide the needed and storing information in a faster, more convenient way by file of the student Enrollees in a computer system that will lessen the effort of faculty staff in storing files of each student every now and then. This will also serve as information especially for the irregular students enrolled (Giovanni M., et.al, 2016).
Related Systems
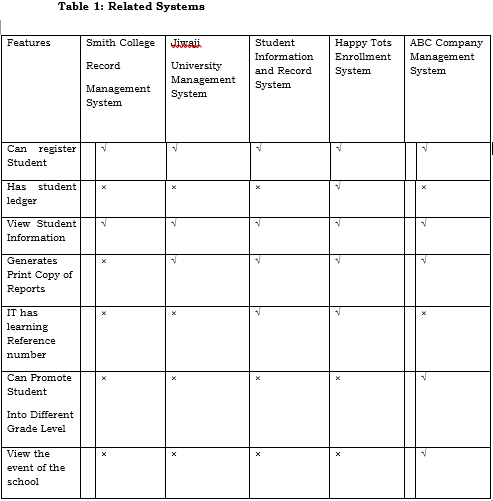
Table 1 Show the features of the system Compared to the related system and studies.
Synthesis
The related Literatures will serve as guide of the researchers in developing the proposed system the class search and registration system is quite similar to our study but ABC Company Management System is not applicable online.
Jiwaji University Management System is also an online portal that promotes paperless transactions. In this study the proponents are promoting less use of paper and through this system the files can be secured Information System can be applied to School for the staff to be able to locate student’s data faster and easy, Unlike the manual system of scanning student’s profiles. Enrollment System can help provide the needed in a more convenient way by using automated system of storing files Student Information and Smith College Record System can provide updated records and reports fast but accurate. through this system the proponents can create an easier way to help the personnel lessen the loss of data reduce the time work of the staff, ensure the security of files.
Methodology
This chapter discusses the methodology used to develop the system, in which the proponents were being guided in establishing the content Management System. There are various approaches of software development process that are used and maintained while developing software and each of these defined and designed approaches follow a particular set of life cycle and processes to ensure efficient software development. Waterfall Model is the method that system will be developed. Waterfall approach of software is development is divided into separate phases and follows a sequential software development process. Each stage is assign to separate team and is maintained to ensure great productivity and to meet the deadline. Phases involve in the waterfall model are Planning, Analysis, Design, Development, Testing, Implementation and Planning Phase.
Planning Phases
This phase defines the solution in the detail what to build, how to build it, who will build it, and when it will be built. During this phase the works through the design process to create the solution architecture and design, writes the functional specification, and prepares work plans, cost estimates, and schedules for the various deliverable.
Analysis phase
This phase defines the requirements of the system, independent from how these requirements will be accomplished. This phase defines the problem that the student is trying to solve. The deliverable result at the end of this phase is a requirement document and it states in a clear and precise fashion. It tries to capture the requirements from the user`s perspective by defining goals and interactions.
Design phase
This phase helps in specifying hardware and system requirements, in defining overall system architecture, and also ensures systematic development of the system. Its drive by the products of the analysis phase and ends in a model or blueprint for the future development.
Development Phase
Now that the system design, is ready code generation begins. Code generation is a conversation of design into a machine readable form. Testing of units can be done separately. In this phase, unit testing is done by the developer himself, to ensure that there are no defects.
Testing Phase
Testing phase occurs as part of development process. The researchers the input and output of the system to determine if the system functioned correctly.
Implementation Phase
Now that the system is fully functional and tested, the group will suggest for implementation to the faculty/staff who will be assigned to operate this. Maintenance is done to deliver these changes in the user’s environment.
Maintenance Phase
Continued maintenance and support is addressed in the phase suggestions made by the users of the system will be considered for its development. This process provides the ongoing maintenance of the system and improve error in the system.
Population of the study
The target population of this study were (1,390) the from Grade7-11 students of the SCHOOL who are officially enrolled in the school year 2016-2017. Which all of them were using manual process in registering student’s information. Therefore, they can surely benefit from the system.
User Acceptance Survey
The developed system will undergo user acceptance testing by the users of the system: Students and the administration of the school, which includes the office of the Executive Director.
Requirement Specification
Operational Feasibility
Basically, the goals of the system were to develop the following functionalities, this system an organized system which allows the Admin to register student, promote students to another level, archive of data. With that said, the system will surely be beneficial to the school.
Program Environment
Front End
HTML or the Hypertext Markup Language is mark-up language for the describing web documents (web pages). A markup language is a set of markup tags. HTML documents are described by HTML tags. Each HTML tag describes different document content.
CSS or Cascading Style Sheets is a style sheet language used for describing the presentation of a document written in a markup language. CSS is designed primarily to enable the separation of the document Content from document presentation, including aspects such as the layout, colors, and fonts
This separation can improve content accessibility, provide more flexibility and control in the specification of presentation characteristics, enable multiple HTML pages to share formatting by specifying the relevant CSS in a separate, C file and reduce complexity and repetition in the structural content.
JQuery is a concise and fast JavaScript library that can be used to simplify event handling, HTML document traversing, Ajax interactions and animation for speedy website development. JQuery is the most popular JavaScript library in use today. jQuery`s syntax is design to make it easier to navigate a document, select DOM elements, create animations, handle events, and develop Ajax applications.
Bootstrap is the most popular HTML, CSS, and JS framework for developing responsive, mobile first projects on the web. Bootstrapping usually refers to the start of self-sustaining process that is supposed to proceed without external input.
It contains HTML and CSS-based design templates for typography, forms, buttons, navigation and other interface components, as well as optional JavaScript extensions.
Back End
PHP is a server-side scripting language designed for the web development, but also used as a general-purpose programming language. Originally created by (Rasmus Lerdorf) in 1994, the PHP reference implementation is now produced by the PHP group. PHP originally stood for Personal Home Page, but it now stands for the recursive acronym PHP: Hypertext Preprocessor PHP code may be embedded into HTML code, or it can be used in combination with various web template systems, web content management systems and web frameworks.
MySQL is the most popular database system used with PHP. MySQL is a database system used on the web. It is a database system that runs on a server. It is ideal for both small and large applications. MySQL is very fast reliable, and easy to use. It supports standard SQL.
Technical Feasibility
Hardware specification (Minimum Requirements)
Client:
- Quad core processor
- 2GB RAM
Server
- Processor- Intel core processor
- Memory- 4GB DDR3 L memory
- Drive- 300 (IDE or SATA)
Software Specifications (Minimum Requirements)
Client:
- Windows 7 operating system
- Browser (Mozilla Firefox, Google chrome)
- MySQL server
Server:
- XAMPP
- Window 7 operating system
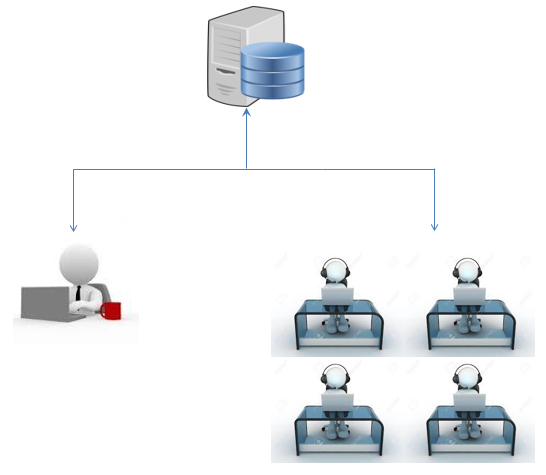
Figure 3: System Architecture
This figure shows the system layout of researched system. The one who can access this system is the Administrator. The system can use by the student and staff of the school.
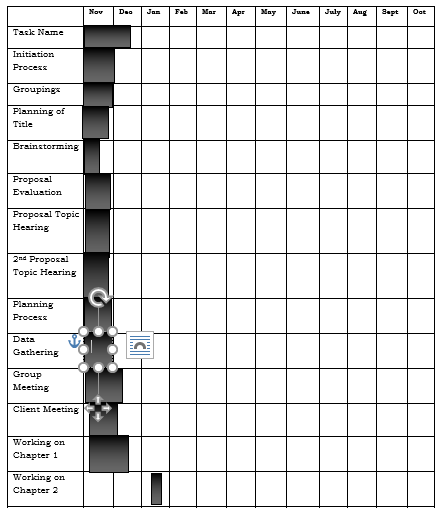
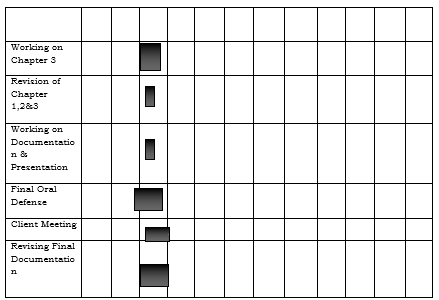
Gantt Chart
Cost Benefit Analysis
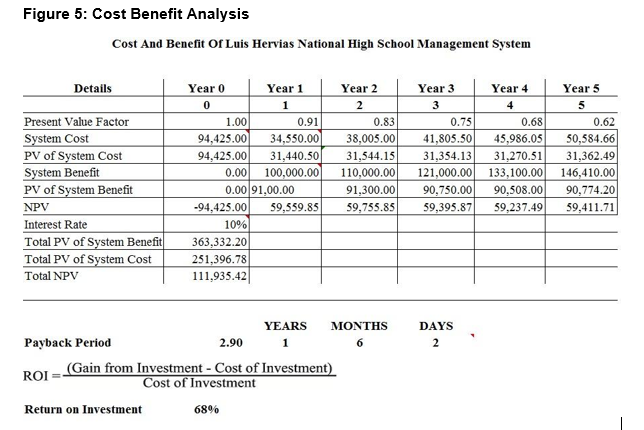
Cost Benefit Analysis or CBA estimates and sums up the equivalent money value of the benefits and cost of the system in order to determine whether it is profitable or worth the investment.
Table 2: Developmental Cost
| Personnel | No. Of Personnel | Duration | Salary | Total |
| Programmer | 1 | 5 months, | Php 6,130.00/mon | Php 30,650.00 |
| Researcher | 1 | 5 months | Php 6,000.00 | Php 30,000.00 |
| Computer | 1 | Php 15,000.00 | Phpb15,000.00 | |
| Desktop | ||||
| Printer | 1 | Php 15,000.00 | Php 15,000.00 | |
| Ink | Php 1,500.00 | Php 1,000.00 | ||
| Electricity | 5 months | Php 455.00 | Php 2,275.00 |
Table 3: Operational Cost
| Duration | Cost | Total | |
| Electricity | 10 months | Php 455.00 | Php 4,550.00 |
| Maintenance | 10 months | Php 1,500.00 | Php 15,000.00 |
| Fee | |||
| Office Supply | 10 months | Php 1,500.00 | Php 15,000.00 |
| Total Php 34,500.00 | |||
Table 4: Benefit of the system
| Benefit of the System(Annually) | Amount |
| Efficiency of work/ output of employee | Php 42,000.00 |
| Confidentially of Data | Php 8,000.00 |
| Work Management of Employee | Php 42,000.00 |
| Toner | Php 3,800.00 |
| Bond Paper | Php 3,600.00 |
| Total | Php 128,975.00 |
Table 5: Total Cost
| Total Amount | |
| Development | Php 94,000.00 |
| Operational Cost | Php 34,550.00 |
| Total Cost | Php 128,975.00 |
This figure shows the benefit analysis of the system. Each figure has corresponding data as shown in this table. The payback period come out as 2.90 with an ROI of 68%.
Entity Relationship Diagram
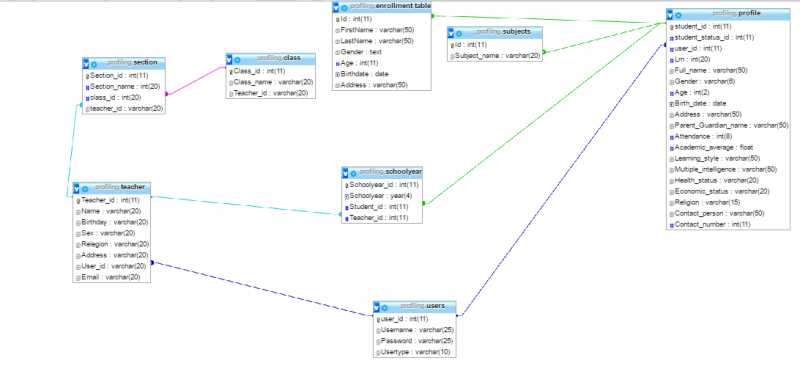
Figure 6: Entity Relationship
The figure shows the entities of the researched system and how it would be connecting with the other entities. The proponents have described what tables would be created and what information would be stored.
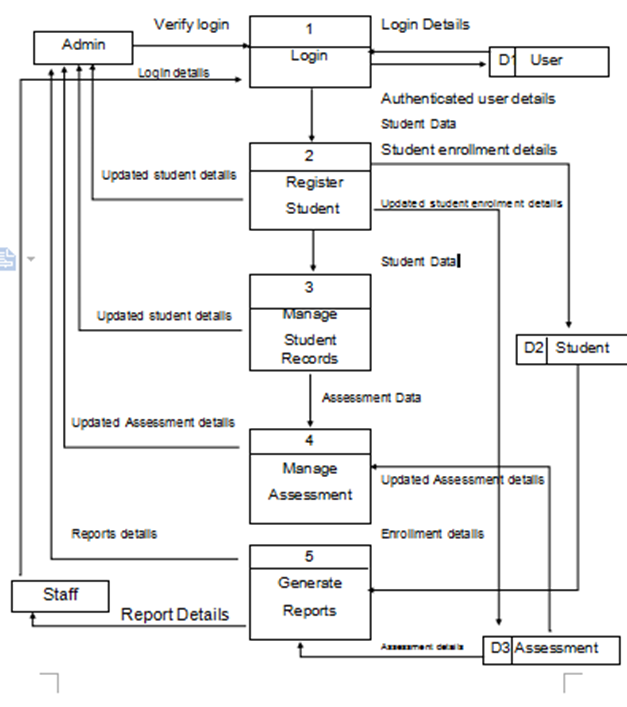
Figure 7:
Show the data flow of the researcher system. The administration can manage who can login the system and who can use the system.
Table1. User table
| Field Name | Field Type | Length | Key | Description |
| User_id | int | 11 | PK | System generated Sequence number for table user. |
| Username | Varchar | 25 | Username of person who entered information | |
| Password | Varchar | 25 | Unique identification pin | |
| user type | Varchar | 10 | Use to defined for the user performing request |
Table2. Class table
| Field Name | Field Type | Length | Key | Description |
| Class_id | int | 11 | PK | Generated sequence Number for the table class |
| Class name | varchar | 20 | Name of class | |
| Teacher_id | varchar | 20 | Generated sequence Number for the table teacher |
Table3. Enrollment table
| Field Name | Field Type | Length | Key | Description |
| Id | Int | 11 | PK | Person identification |
| Student_id | Int | 11 | Generated sequence Number for the table Student | |
| Subject_id | Int | 20 | Generated sequence Number for the table Subject | |
| School year | date | Current school year |
Table4. Event table
| Field Name | Field Type | Length | Key | Description |
| Id | Int | 11 | PK | Person identification |
| Title | Varchar | 20 | Title of the event | |
| Description | text | |||
| Date | date time | Date of event |
Table5. Profile table
| Field Name | Field Type | Length | Key | Description |
| Student_id | Int | 11 | PK | Generated sequence Number for the table Student |
| Student_status_id | Int | 11 | Generated sequence Number for the table Student status | |
| User_id | Int | 11 | Generated sequence Number for the table user | |
| Lrn | Int | 20 | Unique of the Student | |
| Full name | Varchar | 50 | Full name of the student | |
| Gender | Varchar | 6 | Gender identity of the Student | |
| Age | Int | 2 | Age of the student | |
| Birthdate | Date | Date where the student is born | ||
| Address | Varchar | 50 | Address of the student | |
| Parent_guardian_name | Varchar | 50 | Full name of the Guardian | |
| Attendance | Int | 8 | Attendance of the Student | |
| Academic average | Float | Average of the Student | ||
| Learning style | Varchar | 50 | Learning style of the student | |
| Multiple intelligence | Varchar | 50 | Multiple intelligence of the student | |
| Health status | Varchar | 20 | Health status of the Student | |
| Economic status | Varchar | 20 | Economic status of the student | |
| Religion | Varchar | 15 | Religion of the Student | |
| Contact person | Varchar | 50 | Contact person of the student | |
| Contact number | int | 11 | Number of the other person |
Table6. School year table
| Field Name | Field Type | Length | Key | Description |
| Schoolyear_id | Int | 11 | PK | Generated sequence Number for the table School year |
| school year | year | 4 | Current school year |
Table7. Section table
| Field Name | Field Type | Length | Key | Description |
| Section_id | Int | 11 | Pk | Generated sequence Number for the table Section |
| Section name | Int | 20 | ||
| Class_id | Int | 20 | Generated sequence Number for the table Class | |
| Teacher_id | Varchar | 20 | Generated sequence Number for the table Teacher |
Table8. Subject table
| Field Name | Field Type | Length | Key | Description |
| Id | int | 11 | PK | Person identification |
| Subject name | Varchar | 20 | Subject of the student |
Table9. Teacher Table
| Field Name | Field Type | Length | Key | Description |
| Teacher_id | Int | 11 | PK | Generated sequence Number for the table Teacher |
| Name | Varchar | 20 | Full name of the Teacher | |
| Birthday | Varchar | 20 | Birthday of the Teacher | |
| Sex | Varchar | 20 | Current name | |
| Religion | Varchar | 20 | Religion of the Teacher | |
| Address | Varchar | 20 | Address of the Teacher | |
| User_id | Varchar | 20 | Generated sequence Number for the table User | |
| Varchar | 20 | Email of the person who entered information |
Data Flow Diagram
User’s Acceptance Survey
This chapter presents and interprets the results of the User’s Acceptance Survey in the system for School Management System.
Presentations
The proponents select the respondents to be evaluated randomly and demonstrate the system based on their knowledge of interest in computers. The proponents evaluated them using the User Acceptance Survey questionnaire provided by the capstone adviser and gather the data in order to work on the statistical formulas afterwards.
Data Analysis
This section presents the analysis of the data collected from the respondents of the School
Characteristics of the Respondents
The study’s population was composed of the Principal of School, ICT Member, Faculty, as well as the students as the future beneficiaries of the proposed study.
Table 4.0: Frequency of Respondents
Respondents Frequency
Admin 1
Principal 1
Students 23
ICT members 5
Total 30
This table shows the frequency of respondents who have answered the User-Acceptance Survey. The Researcher got a total of 30 respondents.
Reliability Testing
The data gathered by the proponents have undergone reliability testing. An acceptable approach through using the Yamane’s Formula in order to identify the sample size of population that will undergo the user Acceptance Survey.
n – The sample size
N – The population size
e – The acceptable sampling error
= 95% confidence level and p = 0.5 are assumed
TABLE 5.0 RELIABILITY TEST RESUL
| n =30
1+30(0.05)2 n = 30 1+30(0.0025)2
n = 30 1+0.075 n = 30 1.075 n=27.90 or (28)
|
| n =30
1+30(0.05)2 n = 30 1+30(0.0025)2
n = 30 1+0.075 n = 30 1.075 n=27.90 or (28)
|
This table shows the result of reliability testing undergone by the data gathered from the User-Acceptance Survey. The (n) stands for sample size, the (N) stands for total population size of respondents, which is 30. The acceptable sampling error has a value of 0.05 multiply by itself with a result of 0.0025. The population size (n) which is 30 divided by 1.075 the total survey result is equivalent to 27.90 or 28.
Interpretation of Data
The instrument wished to access the perception of the users in terms of five (5) categories namely: Effectiveness, Efficiency, Quality, Timeliness and Productivity. The first category was composed of four (4) items, the second category was composed of three (3) items, and the third, fourth and last categories were composed of four (4) items. The rating scale was 1 to 5 with 1 as very dissatisfied, 2 as dissatisfied, 3 as neutral, 4 as satisfied and 5 as very satisfied.
Table 6.0: Rating Scale
Range of Mean Verbal Interpretation
4.21 – 5.00 Very Satisfied
3.41 – 4.20 Satisfied
2.61 – 3.40 Neutral
1.81 – 2.60 Dissatisfied
1.00 – 1.80 Very Dissatisfied
This table shows the range of mean and its verbal interpretation.
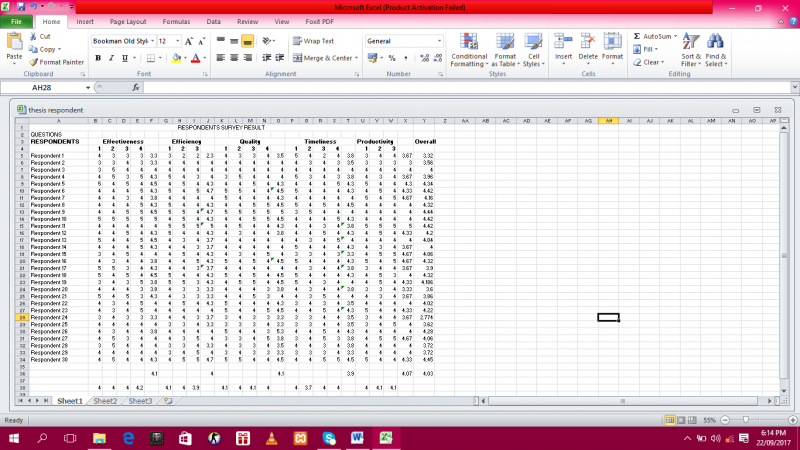
Figure 5: Respondent’s Survey Result
Figure 6 shows the result from the User’s Acceptance Survey wherein 30 respondents have been tested. Each of the categories average was computed. Each computed averages were created tables below to precisely showcase each category’s mean. Users were satisfied with the system’s effectiveness after testing it.
Table 7: Survey Result – Effectiveness
EFFECTIVENESS
Effectiveness
Question 1 Question 2 Question 3 Question 4 TOTAL
Mean 4 4 4 4.2 4.1
Table 7 shows that the user’s survey result for the effectiveness of the system has a total mean of 4.1 which interprets that the users were satisfied with the systems effectiveness.
Table 8: Survey Result – Efficiency
EFFECIENCY
Efficiency
Question 1 Question 2 Question 3 TOTAL
Mean 4.1 4 3.3 4
Table 8 shows that the user’s survey result for the efficiency of the system has a total mean of 4 which interprets that the users were satisfied with the systems efficiency of the system after testing it.
Table 9: Survey Result – Quality
QUALITY
Quality
Question 1 Question 2 Question 3 Question 4 TOTAL
Mean 4.1 4 4.1 4 4.1
Table 9 shows that the user’s survey result for the quality of the system has a total mean of 4.1 which interprets that the users were satisfied with the systems quality of the system after testing it.
Table 10: Survey Result – Timeliness
TIMELINESS
Question 1 Question 2 Question 3 Question 4 TOTAL
Mean 4 3.7 4 4 3.9
Table 10 shows that the user’s survey result for the quality of the system has a total mean of 3.9 which interprets that the users were neutral with the systems timeliness of the system after testing it.
Table 11: Survey Result – Productivity
PRODUCTIVITY
Question 1 Question 2 Question 3 TOTAL
Mean 4 4.1 4.1 4.1
Table 11 shows that the user’s survey result for the quality of the system has a total mean of 4.1 which interprets that the users were satisfied with the systems productivity of the system after testing it.
Based on the tables above, the result of the study’s User’s Survey is above average. There’s no rating below 1. Therefore, it attest that it is a good survey and it is a good system.
Summary of Findings, Conclusions and Recommendations
This chapter presents the summary of the system project, the findings of the study and the conclusion based on the findings. Recommendations are given as called for by the findings of the study.
Summary of Findings
The proponents conducted series of interviews to the company to identify the main problem of the administration. After the evaluation and thorough research, the proponents started to create a system that would help the School and to improve their transaction.
School Management System focus on enrollment of the student. It can also manage the LRN number of the students. It Allow the teachers to monitor the list of enrolled students, schedule of events and activities.
The proponents conducted a user acceptance survey to evaluate the acceptability of the users to the School Management system if it could get a good average rate when it comes to its system effectiveness, efficiency, quality, timeliness and productivity. As the result shown in Chapter 4, the system can get an average rate of 4.03.
Conclusion
Based on the findings, data and feedback that was being gathered in the whole chapter, the proponents concluded that the system is useful to the school because it can easily enroll student and it can provide accurate data of the student. After methodical process, proponents have achieved all the objectives of the study.
Recommendations
In the view of the findings and conclusions of the study, the following are recommended to further improve this project:
- With the use of the system, the school will become more competitive and attract more students.
- The administration should use the system so they can easily enroll and manage the student profile.
- Improving the interface of the system by making it more responsive and adaptive as possible.
- The future researchers who want to use this study as a basis can improve the project by other more functionalities that will exist in the future.
- Continuous system testing will be done on more respondents to improve the functionalities of the study.
Credits
Bermudez, Carl Angelo
Encarnation, Ralf Raven
Estrada, Harish Jr.
Lacson, Arthur Nerri
Madalag, Ciriaco Jr.




Leave A Comment
You must be logged in to post a comment.