ABC Company E-Business System Capstone Project Document
Introduction
In our generation today, most of us are using technology such as smart phones, tablets, and laptops. The use of technology today is very necessary compare to past generation. Because of this technologies, exchanging of information, communication, and transaction is already effortless and more convenient to us people. The development of E-business systems is growing rapidly because of the business transaction is more convenient through online than going to the stores.
E-Business provides the contemporary knowledge of the key issues affecting the modern e-business environment and links theory and practice of management strategies relating to e-business (Routledge, 2018).
E-business is more than just establishing an Internet presence or conducting ecommerce transactions, it concerns redefining old business models and maximizing business value (Kalakota and Robinson, 1999). E-business is defined as the application of information and communication technologies to facilitate the execution of related functions like marketing management, strategy leverage, information systems, logistic management, customer relationship management, and human resources management (Simpson and Docherty, 2018).
As we can see, there’s a lot of students selling and buying products through online for an income. Mostly they are posting it on Facebook and the problem is that you cannot assure that you are buying or selling products to a legitimate people that you don’t know yet. So we will propose a system exclusive only for this campus which is called ABC COMPANY E-business System. This system will make the transaction convenient and safe for all students in this campus.
Background of the Study
The proponents choose the ABC COMPANY E-Business System to help students in selling their items and for the buyers to look for the item that they need. This system will be a big help for the sellers and buyers of ABC COMPANY , this will going to be easy for the customers to look for an item and for the sellers to sell their items in this campus. It will more of a viable and smart option for both parties.
The proponents conducted a study about online buy and selling of items on Facebook. The proponents asked some students who are buying and selling products online. It is risky for them to buy online especially if it is a payment first policy. They are not sure if the item will arrive because they already paid for the item eventhough they don’t have the item yet. They need to wait for days to get it. You’re lucky enough if you cannot encounter scam posts or bogus sellers. This is the reason why the proponents developed the ABC COMPANY E-business System.
Statement of the Objective
This study is design and develop a system for ABC COMPANY.
These are the following aims of the study:
- Develop an e-Business system for ABC COMPANY that can
- Allow the students of ABC COMPANY to have their accounts.
- let the vendors of ABC COMPANY Fortune Towne to post and updates the list of items they sell and the price.
- Allow the vendors to put their products.
- Allow vendors to check the product in the entire list.
- Evaluate the acceptability of the system using the adopted survey instrument based in ISO/IEC 25010 in terms of Effectivenes,
Efficiency, Suitability, Performance, Compatibility, Usability, Realibility, Security, Maintainability, and Portability.
Conceptual Framework
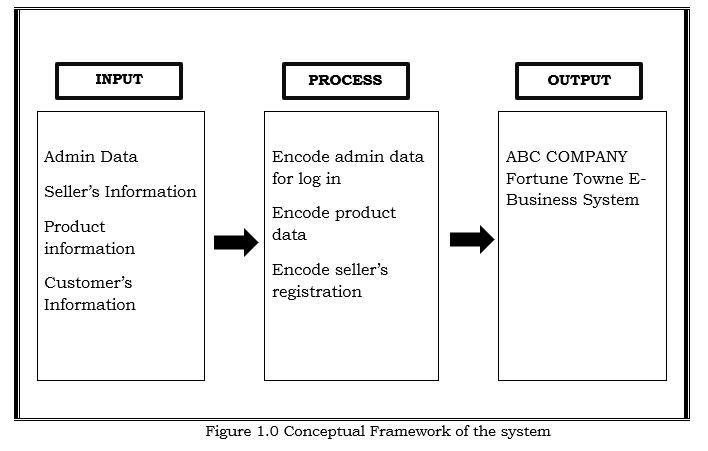
The ABC COMPANY E-business System focuses on the safety and assurance of the sellers and buyers, where administration can easily edit, delete, add, monitor, store and secure all the data from the person involves on the transaction. The proposed system is developed to make the campus more effective in the field of business in a more convenient and safe way.
The ABC COMPANY E-business System is a system that can be accessed by three types of end user. The admin is assigned for the maintenance of the system and the seller is assigned to encode the item that they will going to sell an the buyer to browse for an item that they want to buy. This system can generate records such as total number of items available in each category since items will be categorized based on what type of item is it.
Scope and Limitation of the Study
This section enumerates the scope covered by the study and its delimitation.
Scope
The study covers ABC COMPANY E-business System ,it is a web-base system that focuses on the sellers and buyers in ABC COMPANY Fortune Towne. The sellers and buyers will register in the website, wherein they are able to post and see their products ,and its prices.It will also display reviews and ratings made by customers who had already experienced the transaction.
Limitation
This study is limited to school faculty, students and the three end users; the administrator who are only authorized to maintain and update the records in this system; the seller who encode items that they’re going to sell; the buyer who will inquire for the items they like. Only registered sellers under ABC COMPANY Fortune Towne can post their products in the system. Different categories were created for the products so that the product will be well organized on the system and to minimize the use of the search of button.
Significance of the Study
School
This study will be helpful to the school since ABC COMPANY known as College of Business Management and Accountancy, through this system school will be having a business through online used by their students to practice the life under from a business school.
Students
This study will help them to promote their online business and gain more customer, it will also help them in the way that the transaction will be efficient and effective through online selling as well as buying.
Faculty members
This study it also help them in the way that the transaction will be efficient and effective through online selling as well as buying.
Staff
This study will enable them to have extra income not only to sell but also to buy for a specific product.
Researchers
This system will enable them to apply what they have studied and research. It will help the researchers develop their system and provide more concepts regarding in making documentation.
Future Researchers
They can used this study to widen and it will give them an idea. It will help the future researchers who want to develop or conduct studies about ABC COMPANY E-Business system. It will provide references for farther study that will benefit any researcher who wishes to enhance this existing system.
ABC COMPANY E-Business System
This system provides efficient and effective transactions through an organized system; authority of monitoring and security of records. This system will be beneficial to both sellers and buyers.
Definition of Terms
Administrator. Conceptually, the terms refers to the act or process of administering, especially the management of a government or large institution (Wordnik, 2018).
Operationally, this study the term refers to the person managing the system of ABC COMPANY.
Customers. Conceptually, the terms refers to a specific group of consumers at which a company aims its products and services
(Entreprenaur, 2018).
Operationally, the term refers to the people who use the system of the ABC COMPANY and visit the site for viewing or browsing.
E-Commerce. Conceptually, A commercial transactions conducted electronically on the Internet (Wordnik, 2018).
Operationally, A business conducted via internet.
Portal. Conceptually, it is a term, generally synonymous with gateway, for a World Wide Web site that is or proposes to be a major starting site for users when they get connected to the Web or that users tend to visit as an anchor site (Wordnik, 2018).
Operationally, the term of technology that will use to enter to the system that were created.
Website. Conceptually, This term refers to a kind of system access-able only through web (Wordnik, 2018).
Operationally, It is a World Wide Web pages is usually containing hyperlinks to each other and made available online by a company.
Review Of Related Literature
This chapter discusses the existing study into the context of proceeding related research. These research study cited articles and systems, which are pragmatic are based on research and design of the developer to meet the user’s need.
Local Studies
Online Ordering with Sales Inventory System for RKMI Philippines
According to Johnry Atienza, RKMI has four branches nationwide. The company performs its sales and inventory manually which causes problem for the company. For example, workers have their own notebook for recording the spool and products they have made and it causes delay on their inventory, sales report, and delivery. The study is specifically designed to help RKMI to process one of its tedious and delicate tasks, which are ordering, sales and inventory. Through the system that this study proposes, the problems encountered by the company will be minimized and the workload of the employees will be lessened. Also with the use of the proposed system, the company will be able to widen their market, improve advertisement and increase the number of their customers. The proponents used PHP and SQL in the development of the proposed system. The prototype models served as their guidelines in creating the system. The data flow diagram, entity relationship diagram, and normalization help the proponents to identify the modules that are used by the system (RKMI 2019).
AutoDeal
According to Mr. Daniel M. Scott and Mr. Christopher L. Franks AutoDeal is a automotive marketplace. Everyday we assist car buyers to compare vehicles, find promos and connect with car dealers and private sellers from across the Philippines. The goal of AutoDeal is to simplify the car-buying process by empowering customers before they reach the showroom. With more than 350 partner dealers nationwide, AutoDeal offers car-buyers convenience and transparency by enabling them to find the best offers from multiple dealerships nationwide (AutoDeal 2019).
Kimstore
According to Ms. Kim Lato Kimstore is a online gadget store in the Philippines, pioneering e-commerce and online selling for Small-Medium Entrepreneurs (SMEs) like Ninang Kim. Kimstore’s humble beginnings started as an online store which eventually grew into a full omnichannel business with its very own Technopop retail store as a pickup hub for orders, to answer the growing demand for faster and more efficient order delivery. Kimstore is well-loved for providing only the best products at the most affordable prices, and through outstanding customer service (Kimstore 2019).
Foreign Studies
Online Grocery Shopping
According to Mr. Mark A. Fox, Economies of scale are also necessary for success in the e-Grocery business. For example, regarding deliveries, if large vans are used they can service many more customers, at lower cost than do smaller vehicles that would require constant restocking. This is also a reason that e-Grocery services tend to concentrate on servicing concentrated areas. Finally, it appears that success in the e-Grocery business is linked to vertical integration, i.e., operating a grocery store/warehouse and delivery service, or to alliances with existing grocery stores. This allows for profits to be derived largely from the grocery products themselves. It also allows for grocery warehouses to be situated in locations where the cost of real estate is considerable lower than for traditional grocery stores (First Monday, 2013).
Online Ordering System
According to Mr. Kapchnaga Rogers Wafula, this project is aimed at developing a complete online ordering system for use in the food service industry which will allow the restaurants to quickly and easily manage an online menu which customer can browse and use to place orders with just a few clicks. The customers will have to choose whether they want the food to be delivered to them or it will be packaged for pick up and the payment method will be upon delivery or pick up. There will be a system administrator who will have the right to add and manage user accounts, a manager who will be managing product and orders and last but not least a meal deliverer who will be dealing specifically with pending deliveries. The customer will be in a position to view the products, and place an order. There will be a confirmation receipt for each and every order made by the customer which can be printed (academia, 2019).
Online Shopping System
This project is an attempt to provide the advantages of online shopping to customers of a real shop. It helps buying the products in the shop anywhere through internet by using an android device. Thus the customer will get the service of online shopping and home delivery from his favorite shop. This system can be implemented to any shop in the locality or to multinational branded shops having retail outlet chains. If shops are providing an online portal where their customers can enjoy easy shopping from anywhere, the shops won’t be losing any more customers to the trending online shops such as flipcart or ebay. Since the application is available in the Smart-phone it is easily accessible and always available (CUSAT, 2014).
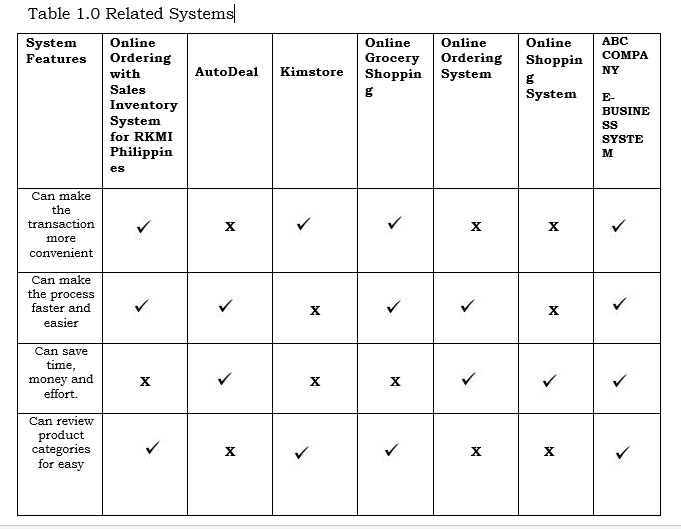
Related Systems
Synthesis
The system that was presented were obtained from foreign and local system study that were made basis for the developed information system.It has also described the features that are available and unavailable in the system.
In connection to the proposed system, ABC COMPANY E-business System will be used by all of the students, faculty and staffs of the campus to buy and sell products since the buyer and the seller is from the same campus. This will be the easier and safe way of buying products since you are only in one campus. In this review, it shows that this e-business system is now an important tool in business industry especially for buyers and sellers of the campus. This related system has made the proponents realized some functions and factors that would help the proposed system to be more advanced,accurate and effective for the users,Furthermore ,the proponents acquire some features in the related studies and merged it to the system to be more beneficial to the company.
Methodology
This chapter explains the methods and procedures being followed in the research projects on how the system flows.
Software Development Life Cycle
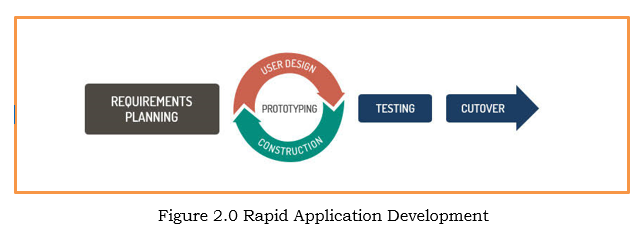
Rapid Application Development (RAD) describes a method of soware development which heavily emphasizes rapid prototyping and iterative delivery. The RAD model is a sharp alternative to the typical waterfall development model, which oen focuses largely on planning and sequential design practices. Basic phases of Rapid Application Development are as follows: Requirement Planning, Prototyping, Testing and Cut-over.
Requirements Planning
During this initial stage, as we selected this model . We had a rough agreement on this project scope and application requirements. We conduct a interview and conduct a study to the ABC COMPANY.
Prototyping
In this phase, Aer we selected the Rapid Application Development as the best fit method for our system. We gathered data with heavy emphasis on determining the system architecture. This allows initial modelling and prototypes to be created.
Testing
In this phase, we conduct a testing survey to the school and evaluated the system. To see whether it functions and operates just how they want it.
Cut-over
Results the final task in the SDLC implementation phase, where the system was concluded to function well. In this phase, the system was presented and testings were made for the student, faculty and staff of the school. And it will be up to the person who assign to approved this system for the school.
Technical Feasibility
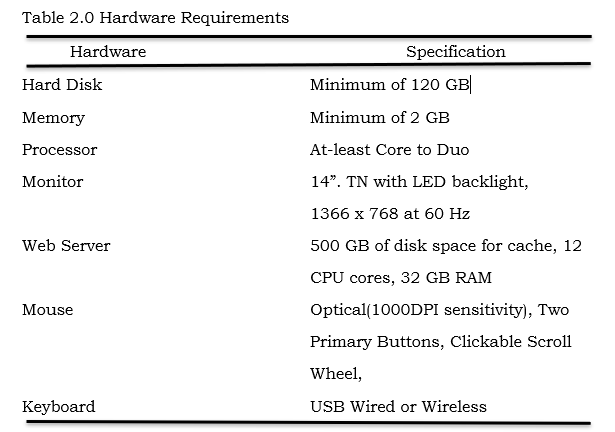
Hardware Requirement (recommended)
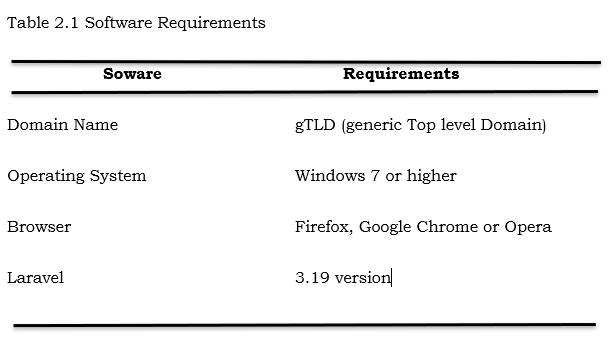
Software Requirements
Program Environment
Front End
BOOTSTRAP
Bootstrap is an open source toolkit for developing with HTML,CSS and JS. Quickly prototype your ideas or build your entire app with Sass variables and mix ins, responsive grade system, extensive prebuilt components, and powerful plugins built on Jquery.(Wama Soware, n.d)
The front end is the admin part of the program that is responsible for the checking of syntax and collecting of input data from the customers. To build the front end of the program, the proponents used the PHP as the main scripting language while HTML and JavaScript for providing the user interface of the system.
Back End
PHP
Stands for “Hypertext Preprocessor.” (It is a recursive acronym, if you can understand what that means.) PHP is an HTML-embedded Web scripting language. This means PHP code can be inserted into the HTML of a Web page. When a PHP page is accessed, the PHP code is read or “parsed” by the server the page resides on. The output from the PHP functions on the page are typically returned as HTML code, which can be read by the browser. Because the PHP code is transformed into HTML before the page is loaded, users cannot view the PHP code on a page. This make PHP pages secure enough to access databases and other secure information.( techterms.com)
The back end is the “Server-side” scripting codes that can be located in the server. To build the back end program, the proponents used the PHP as the scripting language and interpreter that is freely available and used primarily on Linux Web Servers.
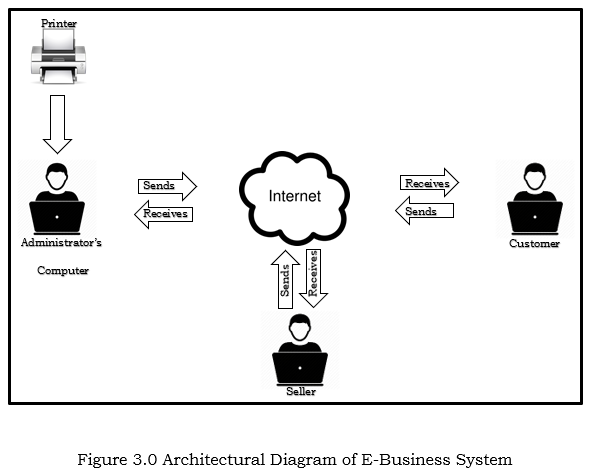
Architectural Diagram
Figure 3.0 displays the structural design of the system wherein the admin has all the access in the system like add, edit, delete and generate reports. However, the tenants are in-charge in adding and updating their record in their page which is to be approved first by the admin to generate reports.
Feasiblity Schedule
The feasibility schedule contains the record of the amount of time the proponents spent on the system.
Grant Chart
The following tables show the Gantt chart of the tass that have been done by the proponents with the time allotted for the establishment of the entire system.
Table 3.0 Requirement Planning
| REQUIREMENT PLANNIG | Percentage Completed | 84% | Total 11 Days | ||||
| Resources | Task | Start | End | Percentage completed | Duration
(Days) |
Completion Percentage | |
| All group members | Group Discussion | Dec. 5, 2018 | Dec. 5, 2018 | 70% | 1 | 70% | |
| Esteban | Assigning members role | Dec. 6, 2018 | Dec. 6, 2018 | 75% | 1 | 75% | |
| Esteban | Segregation of work loads adviser | Dec. 7, 2018 | Dec. 7, 2018 | 80% | 1 | 80% | |
| Draw lots for group adviser | Dec. 8, 2018 | Dec. 8, 2018 | 90% | 1 | 90% | ||
| Esteban | Preparation of sample forms | Dec. 9, 2018 | Dec. 9, 2018 | 85% | 1 | 85% | |
| All group members | Data gathering | Dec. 10, 2018 | Dec. 10, 2018 | 85% | 1 | 85% | |
| All group members | Generate problems | Dec. 11, 2018 | Dec. 11, 2018 | 83% | 1 | 83% | |
| All group members | Create Objectives | Dec. 12, 2018 | Dec. 12, 2018 | 80% | 1 | 80% | |
| All group members | Research on Local studies | Dec. 13, 2018 | Dec. 13, 2018 | 90% | 1 | 90% | |
| All group members | Research on foreign studies | Dec. 14, 2018 | Dec. 14, 2018 | 91% | 1 | 91% | |
| All group members | Create an related systems | Dec. 15, 2018 | Dec. 15, 2018 | 95% | 1 | 95% | |
Table 3.1 Prototyping
| Prototyping | Percentage completed | 87% | Total | 75 | |||
| Resources | Task | Start | End | Percentage completed | Duration (Days) | Completion percentage | |
| All members | System Methodology Modeling | Dec.16, 2018 | Dec.17, 2018 | 90% | 2 | 90% | |
| All members | Data Flow Modeling | Dec.18, 2018 | Dec.20, 2018 | 85% | 3 | 85% | |
| All members | Entity Relationship Diagram | Dec.21, 2018 | Dec.24, 2018 | 90% | 4 | 90% | |
| All members | Creating User | Dec.25, 2018 | Dec.29, 2018 | 90% | 5 | 90% | |
| All members | Encoding of System’s Back end | Dec.30, 2018 | Jan.30, 2019 | 85% | 32 | 85% | |
| All members | Encoding of system’s Front End | Jan.31, 2019 | Feb.20, 209 | 80% | 21 | 80% | |
| All members | Revision of the system and documentation | Feb.21, 2019 | Feb.28, 2019 | 90% | 8 | 90% | |
Table 3.2 Testing
| Testing | Percentage completed | 87% | Total | 10 | ||
| Resources | Task | Start | End | Percentage completed | Duration (Days) | Completion Percentage |
| All members | Testing for bugs and errors | Mar.1, 2019 | Mar.2, 2019 | 85% | 2 | 85% |
| All members | Verifying and testing | Mar.3, 2019 | Mar.5, 2019 | 90% | 3 | 90% |
| All members | Pilot testing | Mar.6, 2019 | Mar.10, 2019 | 85% | 5 | 85% |
Table 3.3 Cut-over
| TESTING | Percentage Completed | 88% | Total | 9 | ||
| Resource | Task | Start | End | Percentage completed | Duration (Days) | Completion Percentage |
| All members | Intstallation of hardware and soware components | Mar.11, 2019 | Mar.12, 2019 | 85% | 2 | 85% |
| All members | Testing | Mar.14, 2019 | Mar.15, 2019 | 88% | 2 | 88% |
| All members | Actual presentation and training | Mar.16, 2019 | Mar.19, 2019 | 90% | 4 | 90% |
| All members | Tu
rn over |
Mar.20, 2019 | Mar.20, 2019 | 90% | 1 | 90% |
Table 3.4 Soware Development Summary
| Phases | Days | Average % Completed |
| Requirement Planning | 11 | 50% |
| Prototyping | 75 | 30% |
| Testing | 10 | 30% |
| Cut over | 9 | 50% |
| RESULT | 3.2 | 50% |
| INTERPRETATION | 3 months | 15 days 7hours |
Cost Benefits Analysis
Cost Benefit Analysis or CBA estimates and sums up the equivalent money value of the benefits and costs of the system in order to determine whether it is profitable or worth the investment.
Table 4.0 Developmental Cost
| Development Cost |
Quantity |
Unit |
No. of Months |
Cost |
Total Amount |
| Computers | 2 | SET | N/A | ₱ 18,000.00 | ₱ 36,000.00 |
| Programmer | 1 | N/A | 5 | ₱ 15,000.00 | ₱ 75,000.00 |
| Systems Analyst | 1 | N/A | 5 | ₱ 15,000.00 | ₱ 75,000.00 |
| Internet | 2 | N/A | 5 | ₱ 8,000.00 | ₱ 80,000.00 |
| Subtotal | ₱ 266,000.00 | ||||
This table shows the developmental cost of the researched system. The developmental cost includes the programmer’s salary and the total expenditures in developing the system.
Table 4.1 Operational Cost
| Operational Cost |
Quantity |
Unit |
Duration |
Cost |
Total Amount |
| Maintenance Cost | 2 | N/A | 12 | ₱ 1000.00 | ₱ 24,000.00 |
| Eletricity | 1 | N/A | 12 | ₱ 2000.00 | ₱ 24,000.00 |
| Printer | 1 | N/A | N/A | ₱ 3,500.00 | ₱ 3,500.00 |
| Bond Paper | 1 | N/A | N/A | ₱ 500.00 | ₱ 500.00 |
| Subtotal | ₱ 52,000.00 | ||||
This table shows the operational cost of the researched system. The operational cost covers the maintenance cost and expenditures in implementing the researched system.
| Developmental Cost | 266,000 |
| Operational Cost | 52,000 |
| Total Cost | 318,000 |
Table 4.2 Total Cost
This table shows the total expenditures of the development and operation of the researched system.
| Benefit | Quantity | Unit | No. of Months | Cost | Total Amount |
| Data Backup | 1 | N/A | 12 | ₱ 1,700.00 | ₱ 20,400.00 |
| Security of Data | 1 | N/A | 12 | ₱ 1,500.00 | ₱ 18,000.00 |
| Accessibility | 1 | N/A | 12 | ₱ 3,800.00 | ₱ 45,600.00 |
| Efficiency of Work Output | 1 | N/A | 12 | ₱ 5,000.00 | ₱ 60,000.00 |
| TOTAL BENEFIT | ₱ 144,000.00 | ||||
Table 4.3 Benefits of the System
This table shows the benefits of the researched system. The proponents have analyzed the presumed amounts or value of each item that would benefit the company.
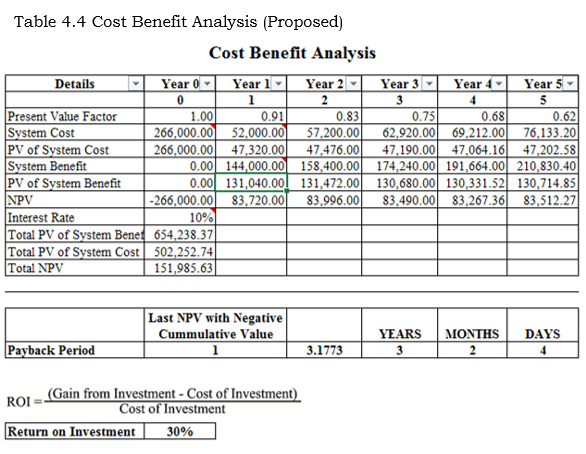
Table 4.4, shows a chart of the Cost and Benefits Analysis. The Return of Investment comes out 30%. The Payback period was computed by taking the sum of the Present Value of System Bene (Php 131,040.00) subtracting it to the Present Value of System Cost (Php 266,000.00) to get its Net Present Value and get the sum of Net Present Value (Php 83,720.00) subtracting it to the negative value of System Cost (Php -502,252.74), and dividing the difference Net Present Value (Php 83,720.00). Resulting to 1.64 which is round to 2 , making it a 2 year payback period. Payback period = Initial Investment/Cash Flow. The ROI was computed by taking the sum of the Total Present Value of System Benefits (Php 654,238.37), subtracting it to the Total Present Value of System Cost (Php 502,252.74).
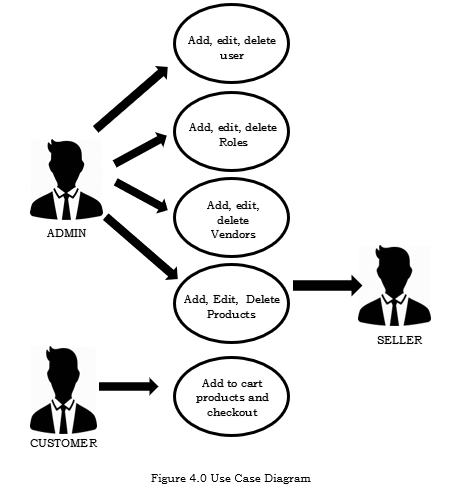
Use Case Diagram
Figure 4 shows the activity of the admin and the authorized personnel in the system. The admin can access all the ransactions that the system provides. Registered users have the privilege to view the system.
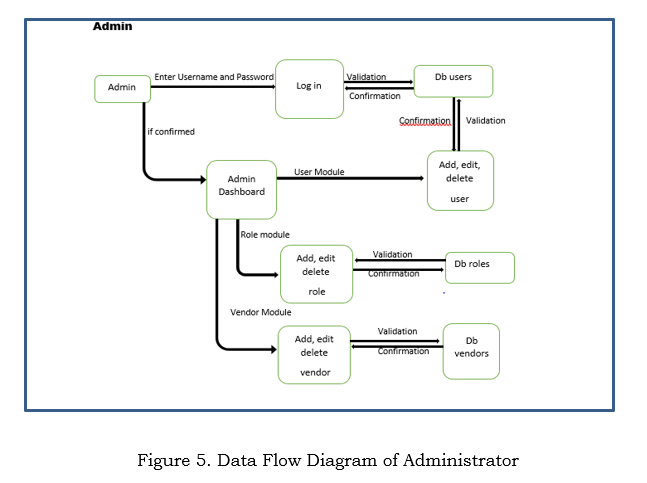
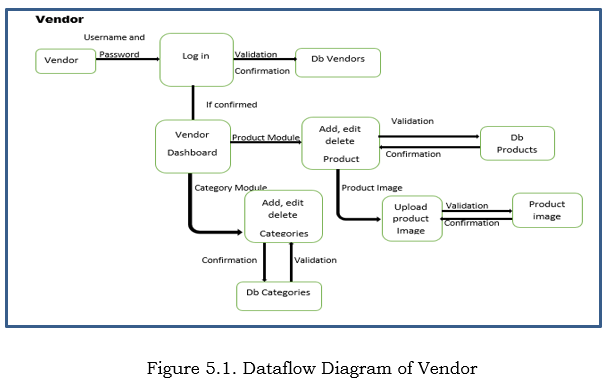
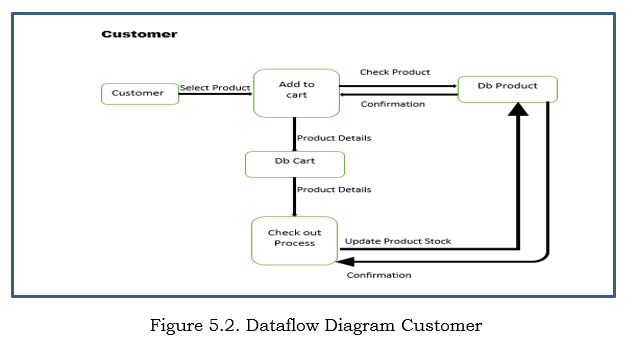
Data Flow Diagram
The flow of the system begins when the admin process the tenants registration; input the tenants information. Next is to process their product that the tenant want to be posted. By the time that the informations are encoded, it will automatically be saved into the database and can be accessed. Then the customer can browse the available products and tenants can log in their registered account.
Database Dictionary
Table 5.0 User table
| User | ||||
| Field | Data Type | Field Length | Constrain | Definition |
| Id | Int | 10 | Primary Key | Unique Identifier |
| Firstname | Varchar | 255 | Not Null | User first name |
| Lastname | Varchar | 255 | Not Null | User last name |
| Username | Varchar | 32 | Not Null | User username |
| userpassword | Varchar | 255 | Not Null | User password |
| Userole | Int | 10 | Not Null | User Role, foreign key |
| is_deleted | Tinyint | 1 | Not Null | 1 = Deleted, 0 = active |
| last_login | Datetime | Null | Login timestamp | |
| created_at | Timestamp | Not Null | Timestamp of inserted data | |
| updated_at | Datetime | Null | Timestamp of updated data | |
Table 5.1 Roles table
| Roles | ||||
| Field | Data Type | Field Length | Constrain | Definition |
| Id | Int | 10 | Primary Key | Unique Identifier |
| Rolename | Varchar | 50 | Not Null | User role name |
| Description | Varchar | 255 | Not Null | Description of roles |
| created_at | Timestamp | Not Null | Timestamp of inserted data | |
| updated_at | Datetime | Null | Timestamp of updated data | |
Table 5.2 Global_Configs Table
| Global_configs | ||||
| Field | Data Type | Field Length | Constrain | Definition |
| Id | Int | 10 | Primary Key | Unique Identifier |
| conf_displayname | Varchar | 255 | Null | Config display name |
| conf_name | Varchar | 160 | Null | Config name |
| conf_desc | Varchar | 160 | Null | Config descriptions |
| conf_tag | Varchar | 160 | Null | Config tag name |
| created_at | Timestamp | Not Null | User Role, foreign key | |
| updated_at | Datetime | Null | Timestamp of updated data | |
Table 5.3 Category Table
| Categories | ||||
| Field | Data Type | Field Length | Constrain | Definition |
| Id | Int | 10 | Primary Key | Unique Identifier |
| Category | Varchar | 160 | Not Null | Category name |
| description | Text | Not Null | Category description | |
| vendor_id | Int | 10 | Null | Vendor ID |
| created_at | Timestamp | 255 | Not Null | Timestamp of inserted data |
| updated_at | Datestamp | 10 | Null | Timestamp of inserted data |
Table 5.4 Vendors Table
| Vendors | ||||
| Field | Data Type | Field Length | Constrain | Definition |
| Id | Int | 10 | Primary Key | Unique Identifier |
| vendor_name | Varchar | 50 | Not Null | Vendor name |
| vendor_mobileno | Varchar | 50 | Not Null | Vendor mobile number |
| vendor_address | Text | Not Null | Vendor address | |
| Username | Varchar | 32 | Not Null | Vendor username |
| vendor_password | Varchar | 255 | Not Null | Vendor password |
| created_at | Timestamp | Not Null | Timestamp of inserted data | |
| updated_at | Datetime | Null | Timestamp of updated data | |
Table 5.5 Products Table
| Products | ||||
| Field | Data Type | Field Length | Constrain | Definition |
| Id | Int | 10 | Primary Key | Unique Identifier |
| p_name | Varchar | 160 | Not Null | Product name |
| p_description | Text | Not Null | Product description | |
| p_price | Decimal | 10,2 | Null | Product price |
| vendor_id | Int | 10 | Not Null | Vendor id |
| category_id | Int | 10 | Not Null | Category id |
| created_at | Timestamp | Not Null | Timestamp of inserted data | |
| updated_at | Datetime | Null | Timestamp of updated data | |
| Quantity | Int | 11 | Null | Product quantity |
Table 5.6 Product_image Table
| Product_image | ||||
| Field | Data Type | Field Length | Constrain | Definition |
| id | Int | 10 | Primary Key | Unique Identifier |
| p_id | Int | 10 | Not Null | Product id |
| p_image | Varchar | 160 | Not Null | Product image |
| created_at | Timestamp | Not Null | Timestamp of inserted data | |
| updated_at | Datetime | Null | Timestamp of updated data | |
Table 5.7 Cart Table
| Cart | ||||
| Field | Data Type | Field Length | Constrain | Definition |
| Id | Int | 10 | Primary Key | Unique Identifier |
| p_id | Int | 10 | Not Null | Product id |
| Price | Decimal | 10,2 | Null | Product price |
| sessionid | Varchar | 32 | Not Null | Session id |
| created_at | Timestamp | Not Null | Timestamp of updated data | |
| quantity | Int | 11 | Null | Product quantity |
Data base Model
Entity Relationship Diagram
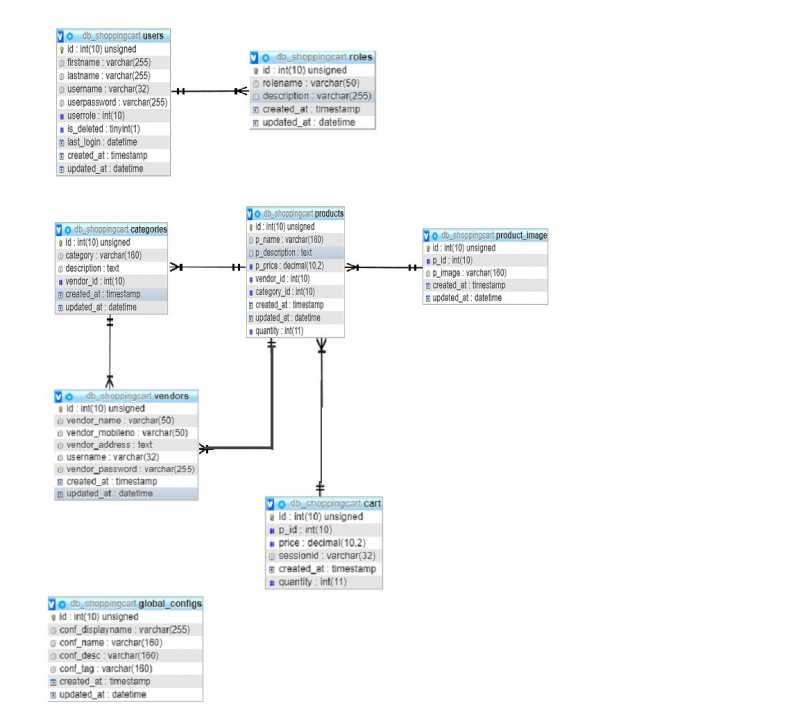
Entity relationship diagram explains every relationship between table’s entitiy and attributes. Each table has a definition that connects evry table, both its primary key and foreign key. Use foreign key if the attributes of the one table have a unique id and foreign key will be indentified when the other attributes are in the onther table. Each attributes coonects in performing every process.
Figure 6.0 Entity Relationship Diagram
Presentation, Analysis And Presentation Of Data
This chapter shows the result of the User’s Survey conducted for the system to the students, faculties and staffs of Abc company Fortune Towne Campus.
Presentation
The proponents demonstrate the system’s functionality to the randomly selected respondents. The proponents observe the repondents on how they response to the system. The repondents were evaluated using the User Acceptance Survey in order for the respondents to distinguish the level of acceptability of the proposed system.
Data Analysis
This section presents the analysis of the data collected and gathered from the repondents of the ABC COMPANY Students, Faculty and Staff.
Characteristics of the Respondents
Table 6.0 Frequency of the Respondents
| Respondents | Frequency |
| Students of ABC COMPANY | 20 |
| Faculties | 5 |
| Staffs | 5 |
| Total | 30 |
The population composed of the ABC COMPANY students, faculty and staffs. The proponents got 30 respondents from ABC COMPANY.
Table 6.0 shows the number of respondents who have answered the User-Acceptability Survey. The researchers got a total number of 30 repondents.
Participants of the Study
The population of the study was determined using purposive sampling with 30 particioants intended for the system which is compried of ABC COMPANY students, faculty and staffs.
Interpretation of Data
| Range of Mean | Verbal Interpretation |
| 4.21-5.00 | Very Satisfied |
| 3.41-4.20 | Satisfied |
| 2.61-3.40 | Dissatisfied |
| 1.81-2.60 | Very Dissatisfied |
| 1.00-1.80 | Poor |
The adopted survey instrument determined the acceptability of the system in terms of five (5) categories namely: Effectiveness, Efficiency, Quality, Timeliness and Productivity. The first category was composed of four (4) questions, the second category was composed of three (3) questions, and the third and last categories was composed of 4 questions. Table 6.0 shows that the user’s survey result for the system’s quality came back with a total mean of 4.27 which interpret that the users were very satisfied with system’s quality aer testing it.
Effectiveness
Table 7.0 Survey Result – Effectiveness
| System Quality Performance Total Mean Verbal Interpretation |
| Effectiveness 4.43 Very Satisfied |
Table 7.0 shows that the user’s survey result for the effectiveness of the system came back with a total mean of 4.43 which interpreted as “Very Satisfied” which means that the end-users were satisfied with the system’s effectiveness aer testing it.
Efficiency
Table 7.1 Survey Result – Effeciency
| System Quality Performance Total Mean Verbal Interpretation |
| Effeciency 4.32 Very Satisfied |
Table 7.1 shows that the users survey result for the system’s efficiency came back with a total mean of 4.32 whick interpret that the users were very satisfied with the efficiency of the system aer testing it.
Quality
Table 7.2 Survey Result – Quality
| System Quality Performance Total Mean Verbal Interpretation |
| Quality 4.34 Very Satisfied |
Table 7.2 shows that the user’s survey result for the system’s quality came back with a total mean of 4.34 whick interpret that the users were very satisfied with the system’s quality aer testing it.
Timeliness
Table 7.3 Survey Result – Timeliness
| System Quality Performance Total Mean Verbal Interpretation |
| Timeliness 4.29 Very Satisfied |
Table 7.3 shows that the user’s survey result for the system’s timeliness came back with a total mean of 4.34 which interpret that the users were very satisfied with the system’s timeliness aer testing it.
Productivity
Table 7.4 Survey Result – Productivity
| System Quality Performance Total Mean Verbal Interpretaition |
| Productivity 4.27 Very Sastisfied |
Table 7.4 shows that the user’s survey result for the system’s quality came back with a total mean 4.27 which interpret that the users were very satisfied with the system’s productivity aer testing it.
System Satisfaction
Table 7.5 Survey Result – System Satisfaction
| System Quality Performance Total Mean Verbal Interpretation |
| System Satisfaction 4.26 Very Satisfied |
Table 7.5 Shows that the user’s survey result for the system’s satisfaction came back with a total mean of 4.26 which interpret that the users were very satisfied with the system’s performance aer testing it.
Over All
Table 7.6 Survey Result – Over All
| System Quality Performance Total Mean Verbal Interpretation |
| Over All 4.27 Very Satisfied |
This table calculated the overall categories of the system’s acceptability and resulted to 4.27 as “very satisfied” which means that the users were very pleased with how system had functioned in all categories given.
Summary of Findings
This study was conducted for the purpose of designing a system for Abc company-Fortune towne Campus, to objectively result to a efficient and effective E-Business System to the School. The descriptive method of research was utilized and the survey technique was used for gathering date. A questionaire serve as an instrument for the collection of data.
We conduct a survey to the ABC COMPANY that the participants were the students, faculties and staff of the school. The survey was conducted aer we present the system of all the requirements, functionalities and features.
The finding of the study of the user’s experience in terms of effectiveness of the system, we obtain a mean score of 4.43, it means interpreted as “very satisfied”. The next categories is efficiency, aer the users experience the efficiency of our system, we obtain a mean score of 4.32, which means interpreted “very satisfied”. On the quality of our system, we got a mean score 4.34 from the users that experience a “very satisfy” quality. On Timeliness category, the users gave a mean score of 4.29
Conclusion
The proponents conclude that the system is fully operational and dynamic, as of the sum of data gathered. This condition is on the premise that it has addressed the necessary automation requirement of the firm aer the through system study.
Recommendation
Based on the findings and conclusion of the study, the following recommendations were given:
- The system would be best implemented to the other campus of ABC COMPANY.
- Add feature that can rate the product and seller.
Credits
Esteban, Arjay L.
Bocado, Xyris John M.



Leave A Comment
You must be logged in to post a comment.