Events Tabulation System Capstone Project Document
Introduction
Computers are still evolving and improving in terms the way they restore, share and access information in the time by which advance technology is still continuing to create more than of what people expect that impossible. Technology develop computer to help people for their uncertain needs.
ABC is a school that provides higher education and promote professional and vocational courses. ABC also provides instruction and training in science, agriculture, and industrial as a vocational course.
Events Tabulation System Capstone Project Document
ABC holds programs to enhance their student’s skills and to provide fun and enjoyment to their students. Since the different events have been organized and promote by the SSG (Supreme Student Government) but there is no electronic system that will calculate the score of every contestant in every event. The judge that is in-charge in every events are still using the manual paper tabulation method to calculate the data/score by which it can cause human error and miscalculation of score.
The goal of this study is to develop a system that will centralize the tabulation process of each judge in different categories of events. As such the whole process can be calculated at a faster rate with a higher accuracy of results.
Background of the Study
ABC Supreme Student Government is planning to enter the world of Information Technology. To create a change in their manual tabulation process during every event that are happening inside the school campus.
Events tabulation system is a system that tabulates the scores given by the judge in every designated event. And it will replace the manual tabulation that the SSG is still using.
Because of this the proponents have decided to conduct a study about the manual process on how they tabulate the results in every contest or events. The group observed that using the manual process is very time consuming for the facilitators of the events. And sometimes the results are not accurate and correct. In solution to this problem the group decided to develop Events Tabulation System (ETS).
This system is for the Supreme Student Government of ABC this will benefit the SSG officers and will lessen their responsibilities during the event.
Statement of the Objective
This study is aimed to develop efficient, effective and productive Automated Events Tabulation System.
The following are the specific objectives:
- Develop a dynamic system that can be use in different kinds of events, during freshmen day, cultural and intramurals.
- Secure the results of every events.
- Lessen the difficulty in tabulating the scores
- Lessen the time in tabulating the scores.
Conceptual Framework
The goal of the study Events Tabulation System is to evolve the manual tabulation process that ABC is still now practicing. The System will lessen the task of every SSG officer that are being assign in the different events that are happening in the campus. Especially for the tabulators of the event because after the judge passes their score sheets the system will tabulate the scores. The system can also print and generate result on that event that are currently happening.
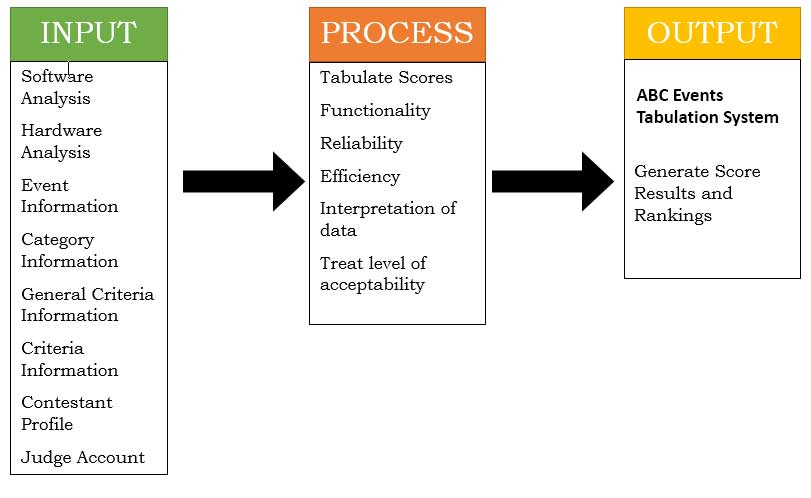
Events Tabulation System Capstone Conceptual Framework
Figure 1: Conceptual Framework
Scope and Delimitation of the Study
This section tells about what are the scope and delimitation covered by the study.
Scope
The study ABC Events Tabulation System Covers and focuses on the Tabulation of every score that is given by the judge in the different events that are conducted by the SSG. The system can also print or generate reports and can produce a line up ranking of contestants. With the use of this system the tabulation of scores will be faster and easier. The system has a security features in order to avoid cheated results. This system is connected to a Local Area Network (LAN).
Delimitation
- This study is limited to the use of the office of the Supreme Student Government, the users depending on the number of judges who will judge the contestants and the administrator who will be the one to maintain the system.
- Can only tabulate the score given by the judge.
- Not applicable for sports events.
- Can only be operated on a Local Area Network (LAN).
Significance of the Study
In this section significance of the study will help you understand who are the people who will most benefit our system and you will also know what are the reasons why this system was made as a study.
Proponents. This are the person who are responsible for developing this system. Because we have find out that using the manual process tabulating it will take a lot of your time and may produce in accurate scores that may lead to misunderstanding.
SSG officer. Results could help benefit the SSG officers to minimize the work and instead of wasting their time in the manual tabulation process they can use their time to other more important things.
Coaches. This study will reserve as a guide for the coaches in order to let them know if all of the results that is being produce is accurate.
Tabulators. The study will enhance involvement in the tabulation process once the judge submitted his or her score sheets the system will be the one automatically will tabulate score.
Future Researchers. This study will serve the future researches to improve their studies that is also related to our study or they can improve and continue this study.
Definition of Term
Conceptual. A statement or description of the fundamental character or scope of something. (“Merriam – Webster Dictionary”, n.d)
Operational. This are the functionality of our system.
Database. Conceptually, is a collection of pieces of information that is organized and used on a computer. (“Merriam – Webster Dictionary”, n.d)
Operationally, database is the place where the data of this system is being stored.
Operationally, this is where data is stored.
Tabulation. Conceptually, Tabulating is way of processing information or data by putting it on a table. This doesn’t mean the kind of table you eat off of, though. It refers to a table, or chart, with rows and column. When tabulating you might have to make calculations.
Operationally, it is the method of the events in order to get the winners of that events.
Automation. Conceptually, automatically controlled operation of an apparatus, process, or system by mechanical or electronic devices
Operationally, to improve the existing manual tabulation.
Tabulators. Conceptually, a person or thing that arranges data in tabular forms.
Operationally, they are the persons who tabulates the score.
Efficiency. Conceptually, the state or quality of being efficient. (Google, 2018)
Operationally, the ratio of the useful work that can be performed by our system
Quality. Conceptually, the standard of something as measured against other things of a similar kind; the degree of excellence of something. (Google, 2018)
Operationally, the characteristics of our system to provide the needs of the SSG in terms of event tabulation.
Productivity. Conceptually, the effectiveness of productive effort, especially in industry, as measured in terms of the rate of output per unit of input. (Google, 2018)
Operationally, A measure of the efficiency of our system ABC Event Tabulation System.
Timeliness. Conceptually, the fact or quality of being done or occurring at a favorable or useful time. (Google, 2018)
Operationally, it is how fast our system can process the information encoded by the SSG Officer and the judge.
Review Of Related Literature
In this chapter all related literature is being compiled in order to know what are the differences of each study to the other.
Local Studies
Computerized Judging System
The SE computerized judging system (CJ55248) is a software by Tasio Espiritu to automate the judging system of any competition with the use of personal computer. This system tabulates the scores given by the judge system is applicable for beauty pageants, singing competition and speech competition. The computerized judging system is so flexible that you can place the contestants picture (Patnubay.org, n.d.)
Automated Scoring System of the AMA Computer College
Automated scoring for AMA Computer College Sta. Mesa Campus.it is under at the category scoring system. This was designed and implemented through LAN and its customizable scoring is for singing contest, dancing contest and pageant. The system develops computerized computation and tabulation of the contestants scores that are given by the judges. the system can generate contest results and who are the leading Contestants
Foreign Studies
Tabulation American Parliamentary Debate Association (APDA) debate tournaments
The system is designed for use by computer-literate, non-technical users. It provides tournament registration, tabulation, judge assignment, and room assignment features, in accordance with typical APDA practices. The system is implemented on a web server owned by the APDA organization, and must maintain a high level of availability. The core algorithm for tabulation is the minimum-weight perfect matching algorithm, a well-known problem requiring polynomial time. The system uses an open-source implementation of that algorithm from the JICOS project.
The goal of this project was to create a reliable system for tabulating tournaments. Using a “web-service” system design allows configuration of the software to be done once, on the server, rather than every time a new user wants to use the software.
Moreover, it facilitates easy access and alteration of the program during tournaments, in the event of an error. Given the prevalence of reliable, high speed internet connections on college campuses, requiring internet access on the part of the user does not create a significant burden. Moreover, the web-service model will work with any computer equipped with a web-browser. (The American Parliamentary Debate Association, n.d.)
Computerizing Contest Information
A computer program has been developed at Purdue University that will greatly reduce the time required to conduct a 4-H contest. The computer program, written in Clipper and Dbase 3.3 Plus, handles registration details including supplying confirmation notices and a printed receipt to all coaches; prints contestant labels; assigns and calculates class cuts when necessary; tabulates scores by age divisions (clover, junior, senior, etc.), organizations (4-H, FFA, etc.), and contest (dairy, crops, horticulture, etc.); and ranks individuals and teams by individual classes and overall contest. The program sets and prints results in a variety of options to fit user needs. (joe.org, n.d.)
Related Systems
Table 1: Related Systems
This table will help you understand what are the different features of our system.
| System Features | ABC Events Tabulation System | Computerized Judging System | Automated scoring system of the AMA computer college | Tabulation American parliamentary debate association (APDA) debate tournaments | Computerizing Contest Information |
| Tabulates the scores given by the judges | P | P | P | O | P |
| Provides PDF reports | P | O | O | O | O |
| Provides Print outs of the scores | P | O | P | O | O |
| Registration for all contestants | P | P | O | O | P |
| Security features | P | O | O | O |
Synthesis
The system presented above are both from local and foreign studies we had get ideas from this system on what will be the finished product of our proposed system. This system also helped as identified what are the features that we need to put in our system
All related systems are similar in nature that they are all tabulation system we have observed that most of our related literature are lack in security features. And also most of this system do not provide Pdf reports.
We the proponents have evaluated the related systems compared it so that we will have come up on what are the features of the proposed system so that it will be more advanced compared to other system.
Methodology
In this chapter the proponents will discuss and explain the phases of the System Development Life Cycle that we have used to developed the system.
The proponents of the study decided that we will use the agile development model. The agile development model has 5 stages that includes the Planning, Requirement Analysis, Designing, Building and testing.
We have chosen this Agile Development model because for us this model is the most compatible model to be used in developing ABC Events Tabulations System.
The stages of this process is connected to one other means that there are processes that are done concurrently or simultaneously. This model is also the best to be used in our project because after the project is finished if they are some updates we can automatically develop again our system.
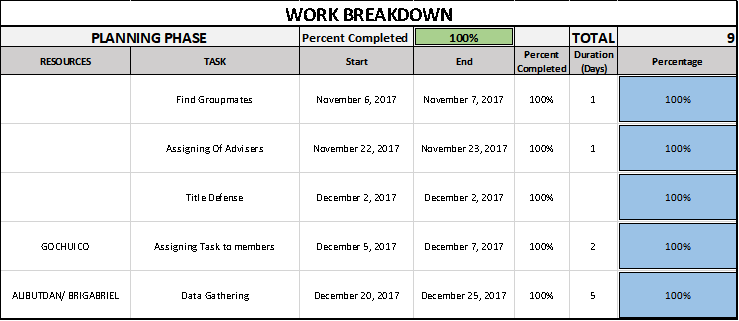
Planning phase
in this phase we the proponents find our groupmates for this research after that our capstone coordinator assigned as to our different capstone advisers and had a meeting on what will be our capstone project title in order to approve that title we have undergo to ah title defense and after our panel have decided what will be our title we had assign the task to each members of the group and we have started gathering data to our specific office that are capstone project will be conducted.
Requirement analysis phase
we had an interview to the SSG officers on what are their requirement of the system that to be developed. We have analyzed the data that we have gathered. Then we created the statement of the objective and the objective. And we conducted a research on the related literature to our system.
Designing phase
We had started to decide what will be the face of our system. And we had made our data flow diagram in order to know what will be the processes inside our system we had also created the Entity Relationship Diagram. And we worked on our system methodology.
Building phase
This is the phase where we had started to code the back end and front end of our system from the data that we had analyzed and what we had gathered in the requirement analysis phase. And we had also created our database.
Testing phase
We had presented our system to the Supreme Student Government explained to them the functionality of our system. And we have conducted a survey with the use of the user acceptance survey. Then we had finished our chapter 4 and chapter 5 in our documentation.
Agile Development Model
Agile development model is also a type of Incremental model. Software is developed in incremental, rapid cycles. This results in small incremental releases with each release building on previous functionality. Extreme Programming (XP) is currently one of the most well-known agile development life cycle models. (istqbexamcertification, n.d.)
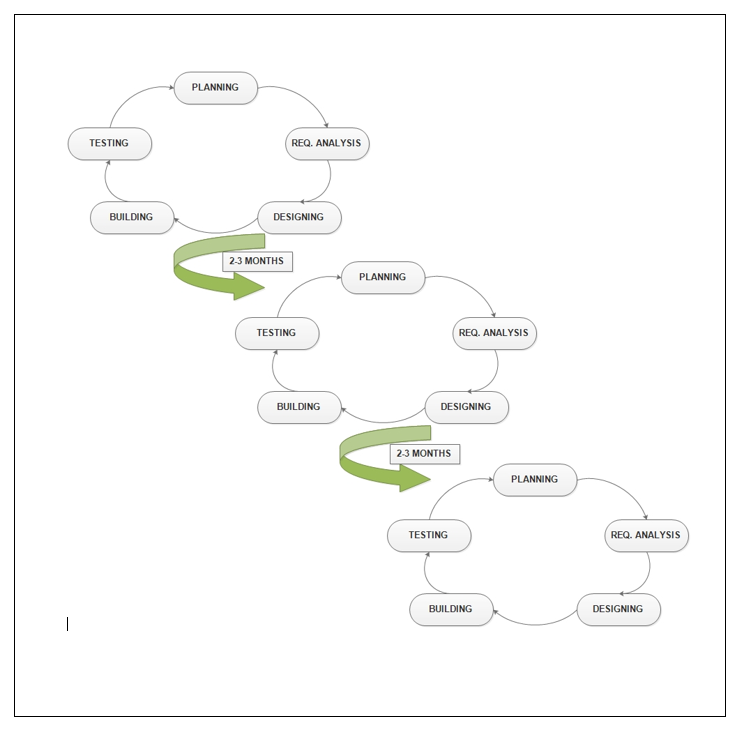
Events Tabulation System Capstone Agile Software Development
Figure 2: Agile software Development
Technical Feasibility
Hardware Requirements (Recommended)
Server and Client
- Hard disk: 250 Giga Byte or Higher
- Memory: 4GB
- Processor: Core 2Duo or Higher
- Network: Gigabit Lan Card
Software Requirements (Recommended)
- Database Software (XAMPP)
- Operating System: Windows 7 or Latest
- Browser: Firefox, Google Chrome, Opera, Safari
- Xampp: 5.0 version up to higher (Apache, MySQL)
Program Environment
Front End
HTML
Is a computer language devised to allow website creation. These websites can then be viewed by anyone else connected to the Internet. It is relatively easy to learn, with the basics being accessible to most people in one sitting; and quite powerful in what it allows you to create. It is constantly undergoing revision and evolution to meet the demands and requirements of the growing Internet audience under the direction of the » W3C, the organization charged with designing and maintaining the language. (yourhtmlsource, n.d.)
CSS
Stands for Cascading Style Sheets. CSS describes how HTML elements are to be displayed on screen, paper, or in other media. CSS saves a lot of work. It can control the layout of multiple web pages all at once. External stylesheets are stored in CSS files. (Google.com, n.d.)
Back end
PHP
Hypertext preprocessor is defined as an HTML-embedded scripting language that is used to write web pages. An example of PHP is a script that displays the date in a website. (Google, n.d.)
JavaScript
Is a programming language commonly used in web development. It was originally developed by Netscape as a means to add dynamic and interactive elements to websites. While JavaScript is influenced by Java, the syntax is more similar to C and is based on ECMAScript, a scripting language developed by Sun Microsystems.
JavaScript is a client-side scripting language, which means the source code is processed by the client’s web browser rather than on the web server. This means JavaScript function scan run after a webpage has loaded without communicating with the server. For example, a JavaScript function may check a web form before it is submitted to make sure all the required fields have been filled out. The JavaScript code can. Produce an error message before any information is actually transmitted to the server. (techterms, n.d.)
MySQL
MySQL is an open-source relational database management system. Its name is a combination of “My”, the name of co-founder Michael Widenius’s daughter, and “SQL”, the abbreviation for Structured Query Language.
Architectural Diagram
Architectural diagram displays the structure of the system and it explains the different roles of the SSG Officer as the administrator and judges. The judges are the ones who will input and submit the score to the system. And it is the responsibility of the SSG officer to check it if the judge’s already input and submitted the scores. The judges will not be able to see the results of the event and only the SSG can print or generate a report.
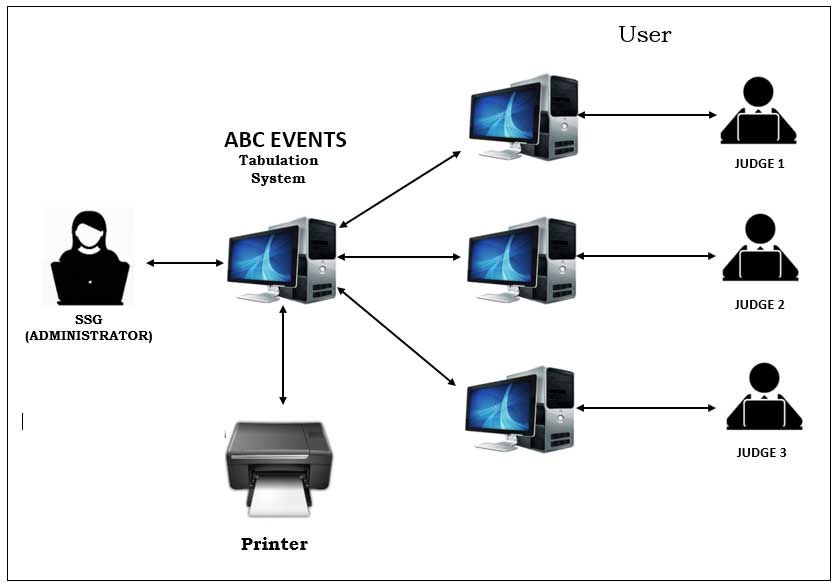
Events Tabulation System Capstone Architectural Diagram
Figure 3: Architectural Diagram of ABC Events Tabulation System
Feasibility Schedule
The feasibility schedule contains all the schedule of the proponents and the time they have spent to develop the proposed system.
Gantt Chart
The tables of the Gantt chart contain all the activity including the schedules that the proponent have spent to establish the entire system.
Table 2.0: Planning Phase
Events Tabulation System Capstone Planning Phase
Table 2.1: Requirement Analysis Phase
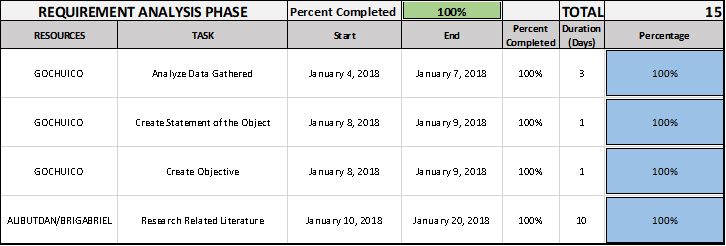
Events Tabulation System Capstone Requirement Analysis Phase
Table 2.2: Designing Phase
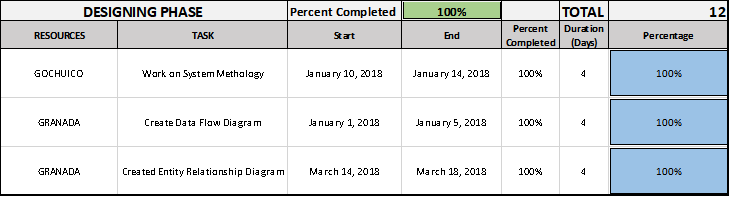
Events Tabulation System Capstone Designing Phase
Table 2.3: Building Phase
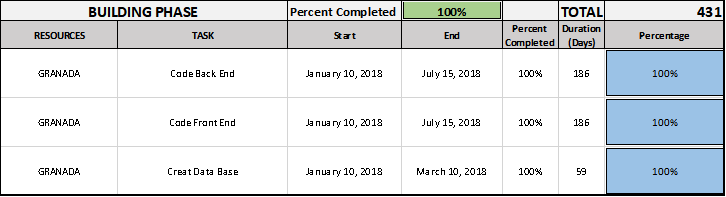
Events Tabulation System Capstone Building Phase
Table 2.4: Testing Phase
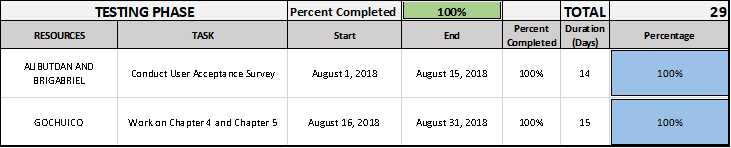
Events Tabulation System Capstone Testing Phase
Table 2.5: Development Summary
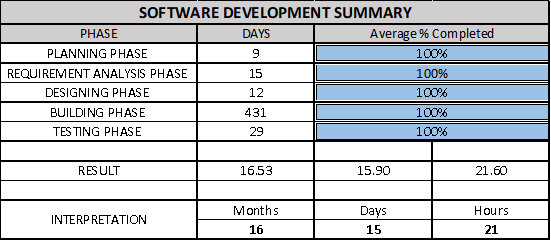
Events Tabulation System Capstone Development Summary
Cost Benefit Analysis
Table 3.0: Development Cost
| Developmental cost | Duration | Cost | Total Amount |
| Computers | N/A | 20,000.00 | 80,000.00 |
| Programmer | 10 months | 17,805.00 | 178,050.00 |
| System Analyst | 10 months | 17,654.00 | 176,540.00 |
| Ink/Toner | N/A | 600.00 | 2,400.00 |
| Bond paper | N/A | 350.00 | 1,750.00 |
| Printer | N/A | 8,000.00 | 8,000.00 |
| Total | 434,590.00 |
Cost Benefit Analysis or CBA is the estimated cost and amount of benefits that the SSG will have with the use of the proposed system, to know whether the company will earn from this system.
Table 3.1: operational Cost
| Operational
cost |
Duration | Cost | Total Amount |
| Electricity (Computers) | 12 | 1,000.00 | 48,000.00 |
| Internet fee | 12 | 1,600.00 | 19,200.00 |
| Maintenance fee | 12 | 3,000.00 | 36,000.00 |
| Total | 103,200.00 |
This table shows the operational cost of the system, this table includes the electricity, internet fee and the maintenance to the system in order to maintain the system to avoid system crash.
Table 3.2: Total Developmental Cost
| Total Amount | |
| Total Development Cost | 434,590.00 |
| Total Operational Cost | 103,200.00 |
| Total | 537,790.00 |
This table shows the total amount of development cost and operational cost. Benefits are the things needed by the company in order that the system will run smoothly and problems may not occur. Listed their above the table are the cost and benefits that the SSG can avail if they will use our proposed system.
Table 3.3 Benefits of the system
| Benefits of the System | Amount/Value |
| Data Backup | 2,000.00 |
| Security of Data | 20,000.00 |
| Accessibility | 15,000.00 |
| Efficiency of Work Output | 50,000.00 |
| Work Management of the SSG officers | 80,000.00 |
| Total | 167,000.00 |
Table 3.3 shows the benefits of the proposed system to the Supreme Student Government and its total presume amounts of each item that will benefit the Supreme Student Government.
Table 3.4 Cost Benefit Analysis
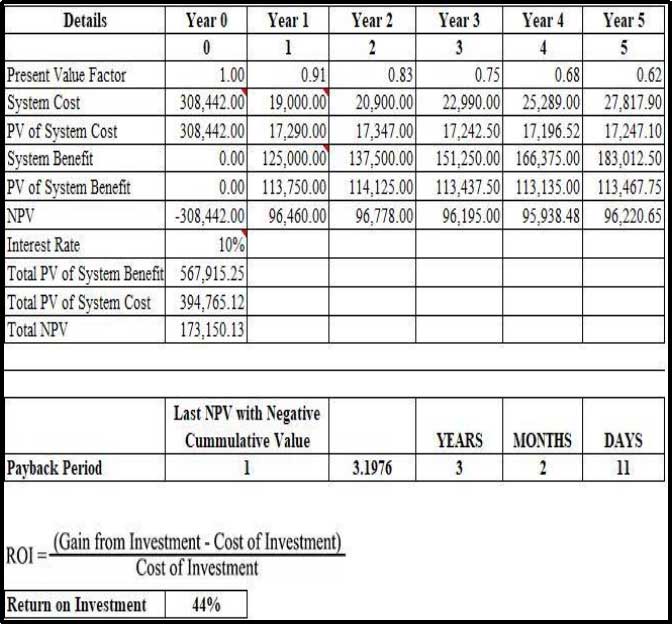
Events Tabulation System Capstone Cost Benefit Analysis
Table 3.4 explains that when the SSG will use our system in year zero the company will have no return on investment but in 2 years’ time the company will be able to regain their investment because the company will have an ROI of 67% percent.
Use Case Diagram
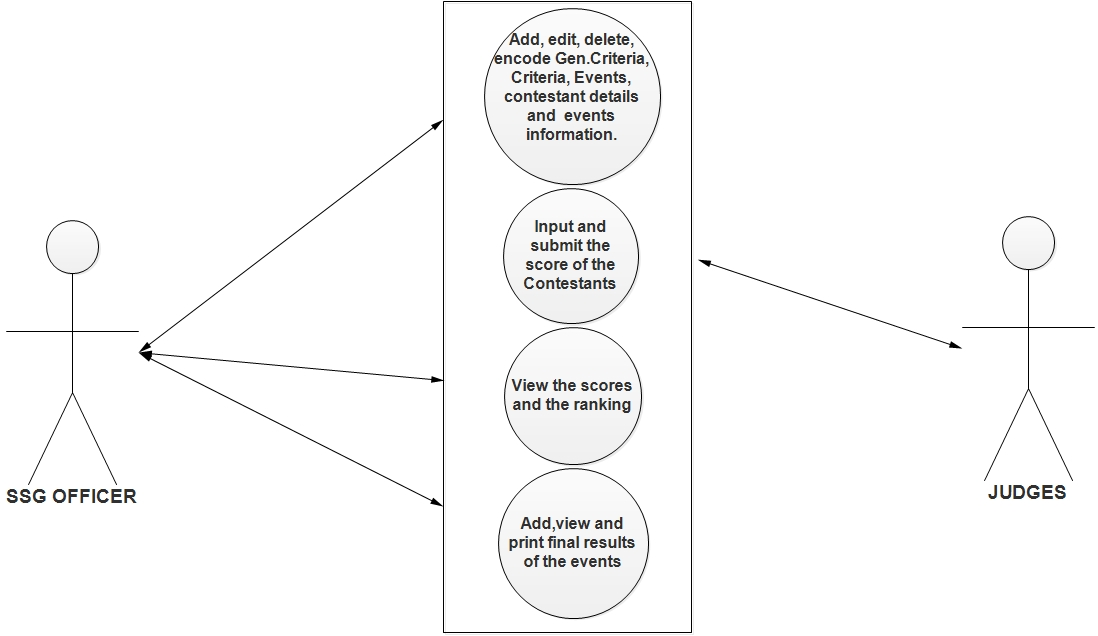
Events Tabulation System Capstone Use Case Diagram
Figure 4: Use case Diagram of ABC Events Tabulation System.
Data Flow Diagram
Our flow will begin in the SSG the SSG will create the event, event category, gen. criteria, criteria inside the gen. criteria provided only if the event is percentage scoring after that the SSG will create an account for the judge in order that the judge will be able to score the event. All of the data will store to their designated databases. After that those data will be checked and will be processed in order that the system will be able to provide a scoresheet for the judges
In the judges interface the judge will be able to see the gen. criteria, criteria and contestant information after the judge log in his or her account. After the judge submits his or her score the score will be tabulated by the system. After tabulation the scores will be stored in the score table. So that the SSG can view the results of that event.
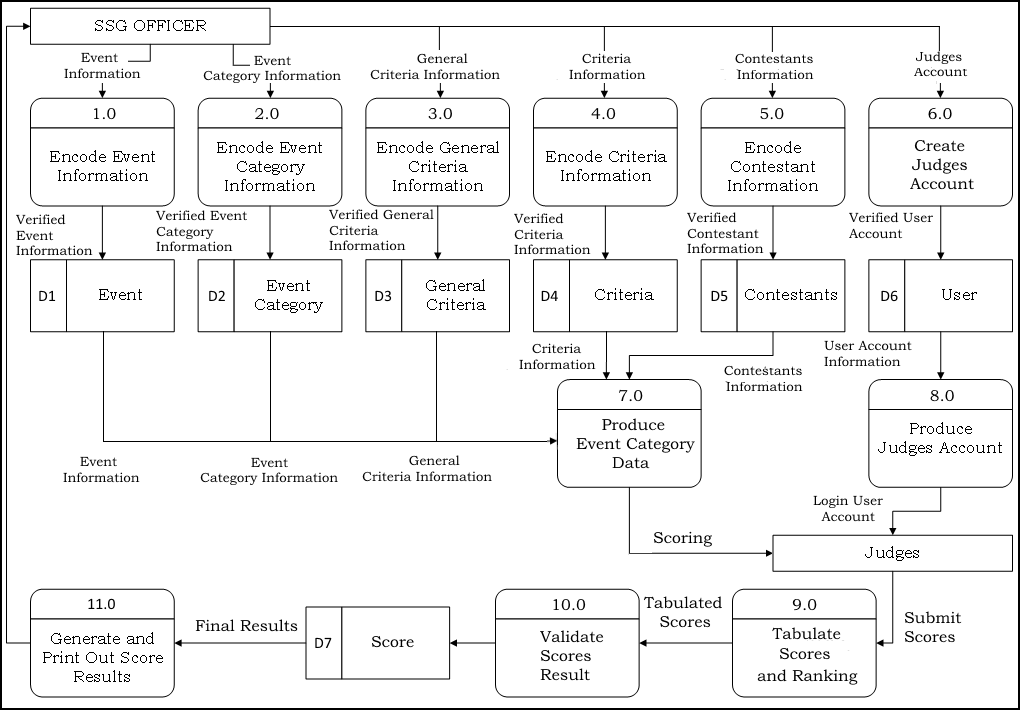
Events Tabulation System Capstone Data Flow Diagram
Figure 5: Data Flow Diagram of ABC Events Tabulation system.
Context Diagram
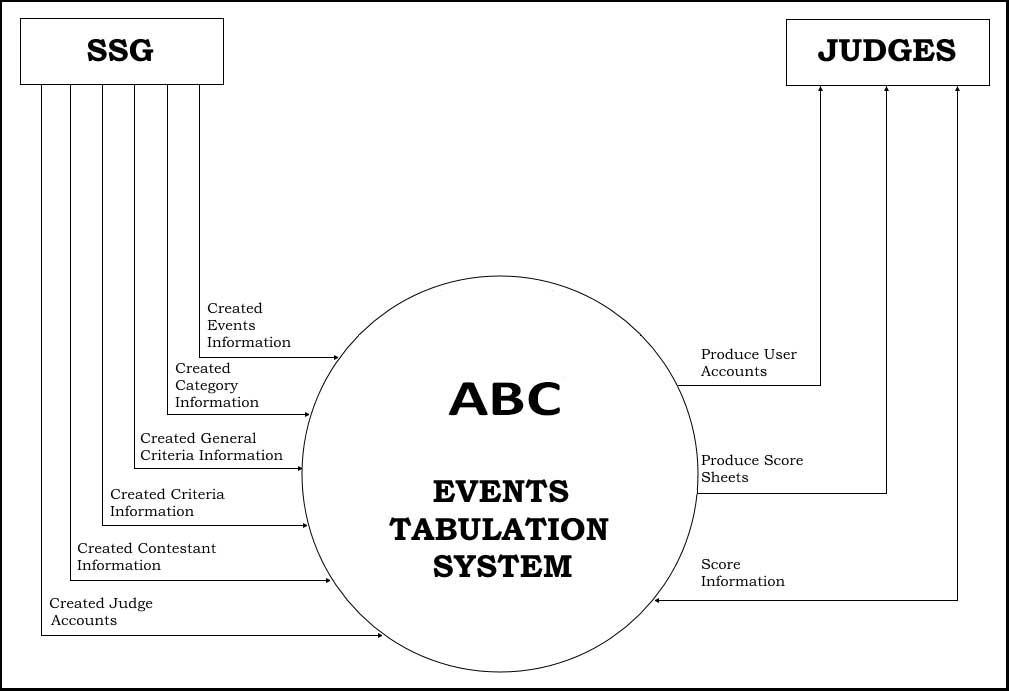
Events Tabulation System Capstone Context Diagram
Figure 5.1: Context Diagram of ABC Events Tabulation system.
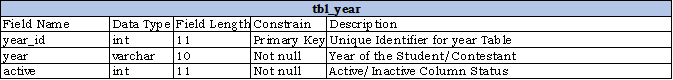
Database Dictionary
Table 4.0 Table category
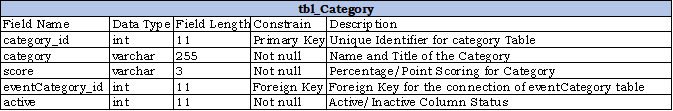
Table 4.1 Table contestant
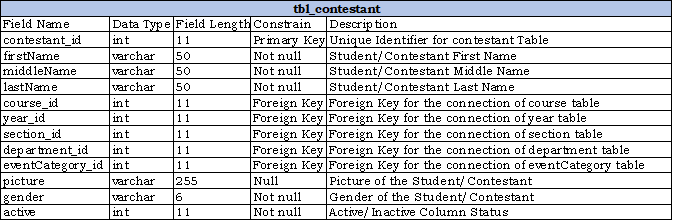
Table 4.2 table course
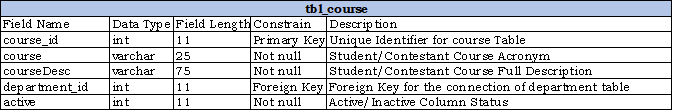
Table 4.3 Table criteria
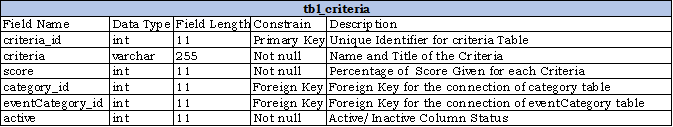
Table 4.4 Table department
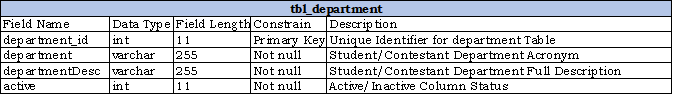
Table 4.5 Table event
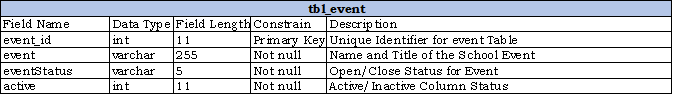
Table 4.6 Table event category
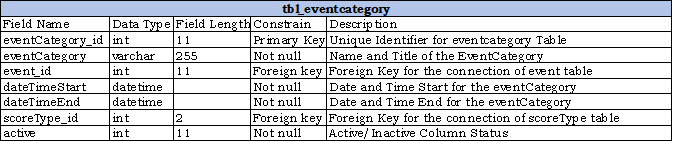
Table 4.7 table judge
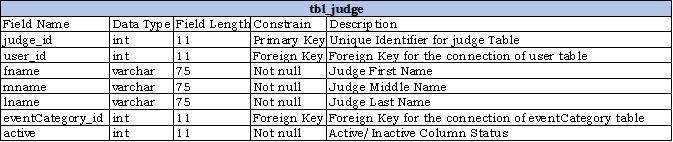
Table 4.8 Table score
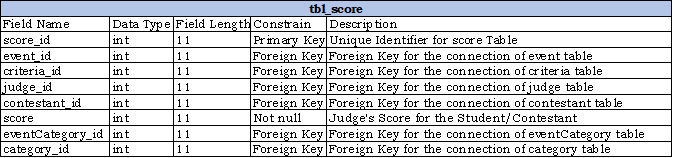
Table 4.9 table score type
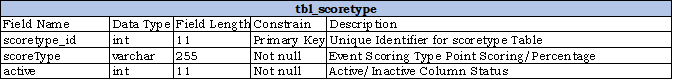
Table 4.10 Table section
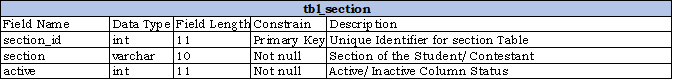
Table 4.11 Table user
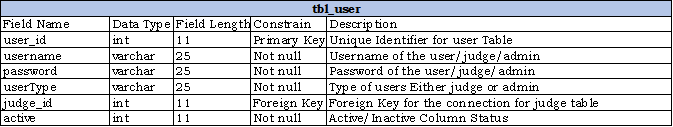
Table 4.12 Table year
Database Model
Entity Relationship Diagram
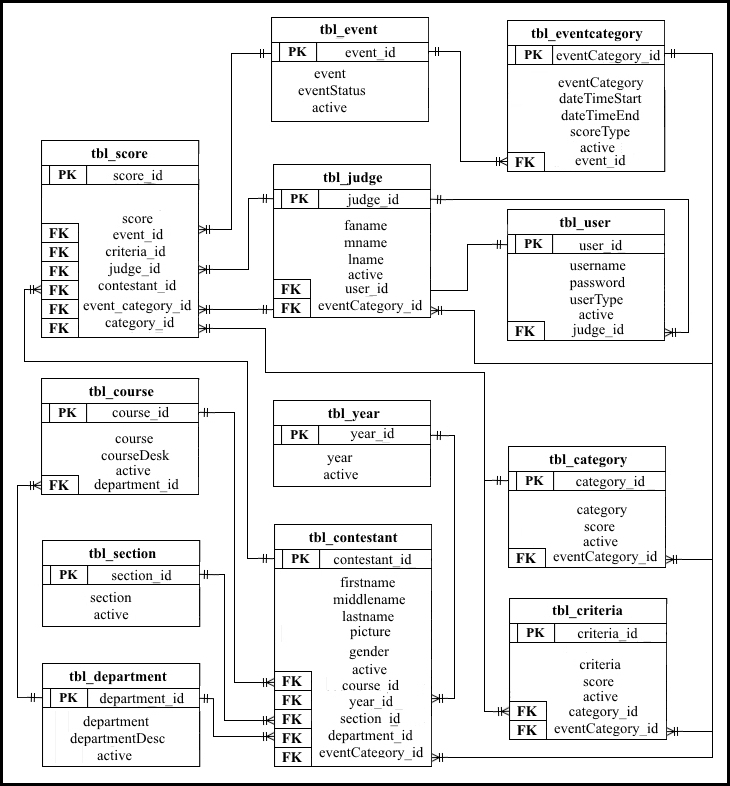
Events Tabulation System Capstone Entity Relationship Diagram
Figure 6: Entity Relationship Diagram
Presentation, Analysis And Interpretation Of Data
This chapter will show and interpret the result of the user acceptance survey that we have conducted for the system ABC Events Tabulation System.
Presentation
The proponents demonstrated the functionality of the system to all of the SSG officers Including their advisers. The proponents observed the reactions of the respondents towards the system. The respondents evaluated the system with the use of the user acceptance survey so that the respondents will able to rate our system properly because this survey have a different level of acceptance category.
Data Analysis
This section will show the analysis of the data that had been gathered from the SSG officers and their advisers.
Characteristics of the Respondents
Table 5.0: Frequency of Respondents
| Respondents | Frequency |
| SSG Adviser | 1 |
| SSG Officers | 37 |
| Total | 38 |
The SSG Office Population is composed of the Officer and their adviser. We the proponents got Thirty-eight respondents from the SSG that includes the adviser and the officers.
Table 5.0 shows the number of respondents that have answered the user acceptance survey. The proponents got thirty-eight respondents.
Reliability Testing
The data that the proponents had gathered undergone reliability testing with the use of the Yamanese formula order.
Yamanes Formula:
n = Sample size
N = Population size
e = level of precision 0.05 % (5%)
Solution:
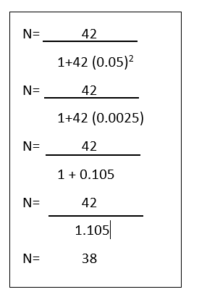
In the reliability testing we used the yamanes formula where n = Sample size, N = Population size and e = level of precision 0.05 % (5%). Where (n) and (N) is the number of our respondent and e is the level of precision that is equal to 5%.
Interpretation of Data
Table 5.1: Interpretation of data
| Range of Mean | Verbal Interpretation |
| 4.21-5.00 | Very Satisfied |
| 3.41-4.20 | Satisfied |
| 1.81-2.60 | Dissatisfied |
| 1.00-1.80 | Very Dissatisfied |
Table 5.1 represents the interpretation of the data. The instrument has a five category namely: Effectiveness, Efficiency, Quality, Timeliness and Productivity. The first category was composed of four items, the second category was composed of three items, and the third, fourth and last categories were composed of four items.
Effectiveness
Table 5.2: Survey Result – Effectiveness
| System Quality Performance | Total Mean | Verbal Interpretation |
| Effectiveness | 4.55265 | Very Satisfied |
Table 5.2 represents that the result of the effectiveness of our system. The result came back with a total mean of 4.55265 that interprets that the SSG officers was Very satisfied with the systems effectiveness after testing it.
Efficiency
Table 5.3: Survey Result – Efficiency
| System Quality Performance | Total Mean | Verbal Interpretation |
| Efficiency | 4.4649 | Very Satisfied |
Table 5.3 represents that the result of the Efficiency of our system. The result came back with a total mean of 4.4649. that interprets that the SSG officers was Very satisfied with the systems efficiency after testing it.
Quality
Table 5.4: Survey Result – Quality
| System Quality Performance | Total Mean | Verbal Interpretation |
| Quality | 4.57236 | Very Satisfied |
Table 5.4 represents that the result of the Quality of our system. The result came back with a total mean of 4.57236 that interprets that the SSG officers was Very satisfied with the systems Quality after testing it.
Timeliness
Table 5.5: Survey Result – Timeliness
| System Quality Performance | Total Mean | Verbal Interpretation |
| Timeliness | 4.51972 | Very Satisfied |
Table 5.5 represents that the result of the Timeliness of our system. The result came back with a total mean of 4.51972 that interprets that the SSG officers was Very satisfied with the systems Timeliness after testing it.
Productivity
Table 5.6: Survey Result – Productivity
| System Quality Performance | Total Mean | Verbal Interpretation |
| Productivity | 4.412275 | Very Satisfied |
Table 5.6 represents that are system is very productive towards its functionality because the total mean of our survey in the productivity section is 4.412275 which is interpreted as Very satisfied means that the SSG agrees that the system is productive for their use.
System Satisfaction
Table 5.7: Survey Result – System Satisfaction
| System Quality Performance | Total Mean | Verbal Interpretation |
| Overall | 4.6053 | Very Satisfied |
We had proved that our system was acceptable and ready to be used by the SSG because according to their response to our survey in the overall system quality performance the result was 4.6053 which means that they are VERY SATISFIED in our system.
Summary Of Findings, Conclusions And Recommendations
This chapter presents the Findings, Conclusion and recommendation for the proposed system.
Summary of findings
The ABC Events Tabulation system was designed and developed for the use of the Supreme Student Government Fortune town campus. the objective of this system is to secure the results of every events. Lessen the difficulty in tabulating the scores and to lessen the time in tabulating the scores given by the judges. We the proponents had conducted a survey in order to know if the system that we had developed is acceptable or not.
We conducted our survey to the officers of the supreme student government and adviser. There are 38 random SSG officers and 1 adviser. The survey was conducted after we developed the system.
The summary of our findings in our survey is: Effectiveness with a total mean of 4.55265 which is interpreted as very satisfied. In the Efficiency of our system it has a total mean of 4.4649 that is interpreted as very satisfied. In the Quality of our system it has total mean of 4.57236 in the Timeliness of our system it has a total mean of 4.51972 that is interpreted as Very Satisfied. In the Productivity of our system it has a total mean of 4.412275 that is interpreted as Very Satisfied and lastly in the Overall result in our survey it has a total mean of 4.6053 and interpreted as Very Satisfied.
Conclusion
- The proponents conclude that the system that we had developed is fully operational and functional based on the five category, Effectiveness, Efficiency, Quality, Timeliness and Productivity. The system is acceptable to the SSG officers.
- Therefore, if this system will be implemented to the SSG Office and will be used in the event that they will be conducting it will help the SSG officers to lessen the difficulty in tabulating the scores and Lessen the time in tabulating the scores. As what is stated in our objective.
Recommendation
The proponents had developed this system ABC Events Tabulation System for the Supreme Student Government ABC campus. We recommend that this system will be implemented in the whole ABC system and the system must be updated one month before the upcoming events in the campus.
References
Google. (2018, September Friday). Retrieved from Google: www.google.com
Google. (2018, September Friday). Retrieved from Google: www.google.com
Google. (2018, September Friday). Retrieved from Goole: www.google.com
Google.com. (n.d.). Retrieved from https://www.google.com.ph.
istqbexamcertification. (n.d.). Retrieved from http://istqbexamcertification.com.
joe.org. (n.d.). Retrieved from https://joe.org/joe/1994june/tt4.php.
Patnubay. (n.d.). Retrieved from http://patnubay.org/dokumento/s4e-inc/se/index.htm.
Patnubay.org. (n.d.). Retrieved from http://patnubay.org/dokumento/s4e-inc/se/index.htm.
technopedia. (n.d.). Retrieved from https://www.techopedia.com/definition/3977/jquery.
techtarget. (n.d.). Retrieved from http://searchwindevelopment.techtarget.com/definition/Ajax.
techtarget. (n.d.). Retrieved from http://searchwindevelopment.techtarget.com/definition/Ajax.
techterms. (n.d.). Retrieved from https://techterms.com/definition/javascript.
The American Parliamentary Debate Association. (n.d.). Retrieved from http://erikdemaine.org/theses/bhebert.pdf.
Vocabulary. (n.d.). Retrieved from (https://www.vocabulary.com/dictionary/tabulate).
yourhtmlsource. (n.d.). Retrieved from http://www.yourhtmlsource.com/starthere/whatishtml.html.
yourhtmlsource. (n.d.). Retrieved from http://www.yourhtmlsource.com/starthere/whatishtml.html.
Leave A Comment
You must be logged in to post a comment.