Exam Scheduling System Capstone Project Document
Introduction
Examination is one of the most important part of going to school. The main purpose of the examination is to make a review of the lessons covered and assessment of student’s knowledge. One of the factors of having exams is the schedule, students cannot just take the exam any time they want. Most of the institutions have assigned schedule for certain subjects that is made by someone who is assigned to do it and he/she should submit it to the person in charge to distribute the schedule.
Online Exam Scheduling System contains the year level, sections, subjects, dates and proctors that are involved during the given dates of the exam.
This study aims to develop a system that will make scheduling system available to everyone who is involved during the examination period.
Exam Scheduling System Capstone Project Document
Background of the study
With the number of students in ABC, it is rarely possible to inform each and every student their own schedule for the exam. The school would sometimes post the schedule on the bulletin board but most of the time the papers gets ripped or destroyed.
This proponent conducted a study about ABC current scheduling system to be time consuming. In some cases, some students that doesn’t have classes on the particular day the schedule is released it would be a big inconvenience for them to go to school just to check their schedule or every time the schedule is released, students would gather around the schedule bulletin and cause a commotion resulting of damaging the schedule bulletin.
Statement of the Objective:
General Objective:
This study aims to develop a user friendly Online Exam Scheduling System that can provide an easier and faster way to view the schedule for the examination.
Specifically, this study aims to develop the following:
- Reduce the complexity of creating suitable exams timetables that satisfies students.
- Help avoid mistake and conflicts.
- Provide flexibility by having the possibility of providing more than one appropriate tables and gives the chance to choose the most convenient.
Conceptual Framework:
This system is intended to collect schedule from the institution and convert it into an online system. Online Scheduling System is a system that is accessible to two types of user. The staff who posts the schedule the students and faculty that can only view the schedule.
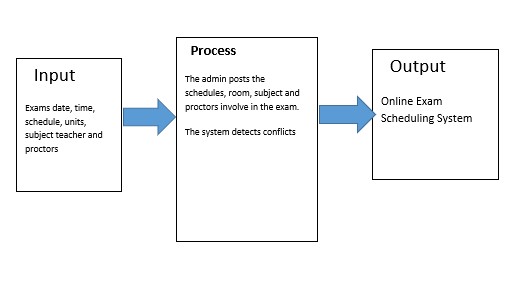
Exam Scheduling System Conceptual Framework
Figure 1: Conceptual of Online Examination Scheduling System
Scope and Limitation of the Study:
This section enumerates the scope covered by the study and its delimitation.
Scope
The study covers Online Exam Scheduling System, that focuses on the entire college. This system will arrange the schedule by course, year and section. Through this system, the person distributing the schedule can do it in a paperless way. This allows the students view their schedule’s anytime they want. By this system, the school will no longer need to print out schedule and post it on the bulletin board.
Limitations:
These are the limitations of the Online Exam Scheduling System
- Only the administrator can update the examination schedules.
- The administrator should update the schedule every examination period.
- Changes on the system such as adding, editing or deleting of data can be monitored by the system.
Significance of the Study:
This study is intended to test the functionality of an exam scheduling system in terms of speed, accuracy, data handling, security, stability and adaptability in making exam schedules.
Students. This system will be most beneficial for students since it will lessen the hassle or effort to go to the admin office just to inquire about their own exam schedules.School. This will greatly ease the responsibilities of the persons-in-charge in preparing schedules every examination period.
Admin/dean. This will help make his/her work more efficient and less time consuming.
Definition of terms
System. Is a collection of elements or components that are organized for a common purpose. The word sometimes describes the organization or plan itself.
Date. A date is a specific time that can be named, for example a particular day or a particular event.
Time. Time is what we measure in minutes, hours, days and years.
Units. A college unit is a term used to define the time value of a course, or a unit of time involved in class instruction.
Teacher. A teacher is a person who teaches, usually a job at a school or similar institution.
Proctors. A proctor is a person that will supervise you while taking an exam.
Schedule. A schedule is a plan that gives a list of events or task and the times at which each one should happen or be done.
Online. Services that become available on the internet.
Online exam scheduling system. A web-based system that helps arranging examination for students which determine when, where and how examination is to be conducted.
Review Of Related Literature
This chapter discusses the existing study into the context of proceeding related research. These research study cited articles and systems, which are pragmatic are based on research and design of the developer to meet the user’s need.
Local Studies
According to Dr. Dibon, Stated that teachers and students expressed concern that higher level of frustration and stress due to lack of assigned time to prepare classes can negatively impact on their interactions with students. He added that the lack of preparation time can also result in classes that are not planned/prepared as well as they could be. Further, when a teacher doesn’t have time to properly assess student work, in a timely fashion, and has little time to provide tutorial classes, remedial work for students who need extra help is often compromised. Having adequate preparation time is a critical factor to a teacher satisfaction. In this Study, the proponents aim to develop an “E Faculty Loading” that will help organize the teachers’ workload. When teachers are satisfied with the amount of time they had for preparation they were much more positive about their work and profession in general.
According to Gordon Smith (2007), the need for a computerized system is very much essentials to establishments, especially schools. It will provide a great help when it comes to organizing and speeding up process of work in offices. Senior Scheduling System is a powerful tool designed to help create school’s master schedule. The schedule created by the scheduling system can be analyzed, adjusted and rerun an unlimited number of times until the desired results are achieved. The power of Scheduling system will greatly reduce the time it takes to create school’s faculty schedules.
Foreign Studies
According to John Hopkin’s Unisversity S.Y. 2011-2012 , Homewood(John Hopkin’s University S.Y. 2011-2012) prioritize the schedule system resource to be used as fully efficient as possible. The schedule system provides equitable access to a variety of rooms, time management and faculty information, as well as to provide the students to search on their own. prioritize the schedule system resource to be used as fully efficient as possible. The schedule system provides equitable access to a variety of rooms, time management and faculty information, as well as to provide the students to search on their own.
According to Los Angeles College (2013), the new semester of 2012 school year has gone live with a cognos-based faculty and students schedule management system that was designed by Irvine. Moreover, the schools schedule management system planning, implement, updating, and checking of faculty and student’s information was inspired by the advancement of modern technology. Furthermore, the schedule system management is also used to view and give the access to the students search their rooms, subjects and faculty members in the school.
Related Systems
| System Features | E Faculty Loading | Senior Scheduling System | John Hopkin’s University | Los Angeles College |
| Automatic Generation | √ | √ | ||
| Belong to a college/university | √ | √ | √ | √ |
| Online Version | √ | |||
| Up to Date | √ | √ | √ | √ |
| Search Criteria | √ |
Table 1: Related Systems
Table 1 shows features of the proposed system in the first column, whereas the following columns are the features of the related systems.
Synthesis
The system that was presented were gathered from both local and foreign systems. It also has the some of the features that will be available on the system and the features that the system does not have.
All related systems discussed share the similar goal which is to be efficient and observed to have more features.
The system discussed are correlated to the proponents’ system, the Online Exam Scheduling System. The researcher analyzed and evaluated the related systems based on functions.
The related system has made the proponents gather some ideas that would be some help for the proposed system.
Methodology
This chapter will explain the methodology of Online Exam Scheduling System building.
Methodology means the method that will be used to build this system. In addition, methodology is the most important part in system development. Online Exam Scheduling System will use System Development Life Circle (SDLC).
SDLC is a series of phases in the development process. It provides a model for development and lifecycle of an application. The SDLC process will help to produce the effective, cost-efficient, and high quality of the system. There is several type of SDLC; Waterfall model, Spiral model, V-model, Iterative model, Big Bang model.
Planning Phase
The planning phase will conclude all of the collected data that is needed to develop the systems. It includes all the detailed steps and work plan. This process will make sure that the idea of the system development work smoothly. In this chapter the specification of the system scopes is listed. Furthermore, the features system planning is concluded in this phase as well.
Analysis Phase
The system that have been done before are analyzed in this phase. Identify the problems of the existing system. The general recommendation on how to fix enhances or how to replace the current system will be analyzed from the problems recorded. Furthermore, the user need also will be analyzed to make sure the Online Exam Scheduling System is user friendly and suitable to be implemented.
Design Phase
In this place the proponents developed a design the system that will provide the needs of the College. After the decided design & features of the system, the programmer start developing the system.
Coding Phase
In this phase, the programmer programs the system and follow specific coding requirements.
Testing Phase
In this phase, the researcher will test the input and output of the system to determine if his system gives the correct operation that is provided. The researcher invited students from the college to test and rate the system.
Implementing Phase
In this phase, the system is already developed and tested. It will be implemented to the college for observation if it is efficient and effective.
The model below illustrates the modified waterfall model
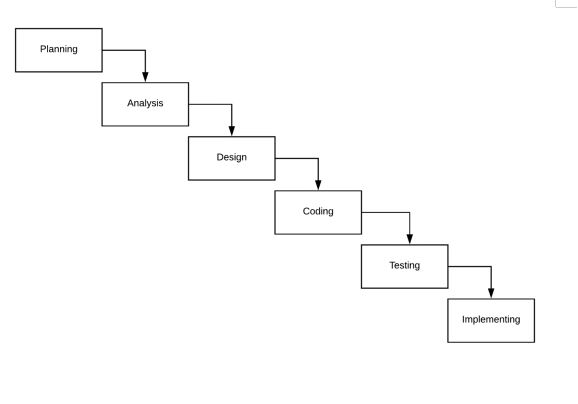
Figure 2: Modified Waterfall Model
Technical Feasibility
Hardware Requirements (Recommended)
Server
- Hard disk: 500MB or higher
- Memory: 2GB
- Processor: Core i3 or higher
- Monitor
- Mouse
- Network: Browser, Internet and OS
Client
- Web Browser capable devices
Software Requirements (Recommended)
Server
- Operating System: Windows 7 or Latest
- Browser: Firefox, Google Chrome, Opera
- Apache, MySQL
Client
- Web Browser capable devices
Program Environment
Front End
HTML
Hypertext Markup Language, a standardized system for tagging text files to achieve font, color, graphic, and hyperlink effects on World Wide Web pages. Hypertext Markup Language revision 5 (HTML5) is markup language for the structure and presentation of World Wide Web contents. HTML5 supports the traditional HTML and XHTML-style syntax and other new features in its markup, New APIs, XHTML and error handling.
CSS
Cascading Style Sheets (CSS) is a style sheet language used for describing the presentation of a document written in a markup language.
A cascading style sheet (CSS) is a Web page derived from multiple sources with a defined order of precedence where the definitions of any style element conflict.
Back End
PHP
PHP is a server-side scripting language designed for web development but also used as a general-purpose programming language. Originally created by Rasmus Lerdorf in 1994, the PHP reference implementation is now produced by The PHP Group.
MySQL
MySQL is an Oracle-backed open source relational database management system based on Structured Query Language. MySQL runs on virtually all platforms, including Linux, UNIX and Windows. Although it can be used in a wide range of applications with web applications and online publishing.
Architectural Diagram
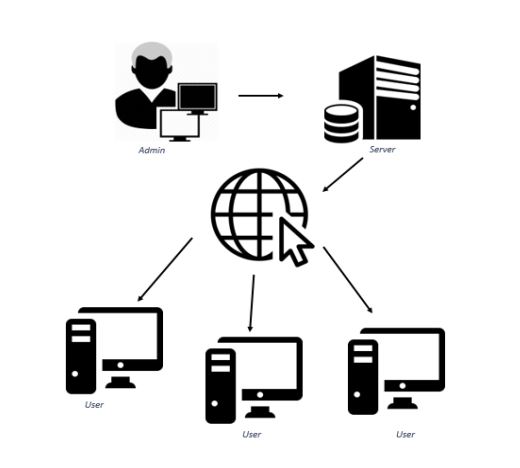
Figure 3: Architectural Diagram of Online Exam Scheduling System
Feasibility Schedule
The feasibility schedule contains the record of the amount of time
the proponents spent on the system.
Gant Chart
The following tables show the Gantt chart of the tasks that have been done by the proponents with the time allotted for the establishment of the entire system.
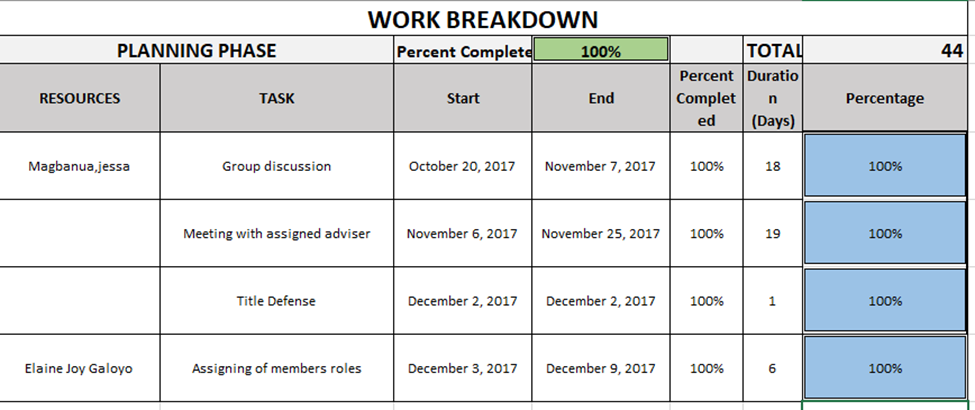
Figure 4.0: Planning Phase
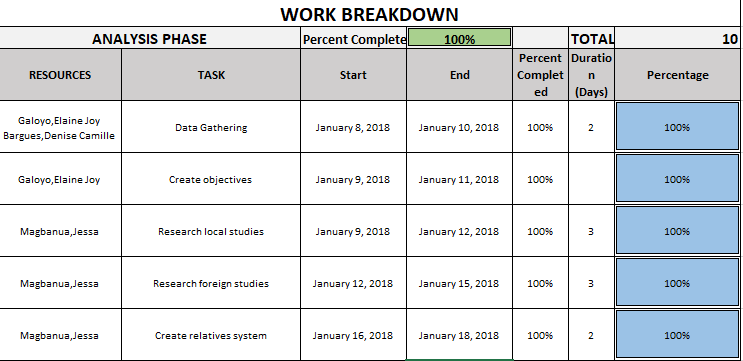
Figure 4.1: Analysis Phase
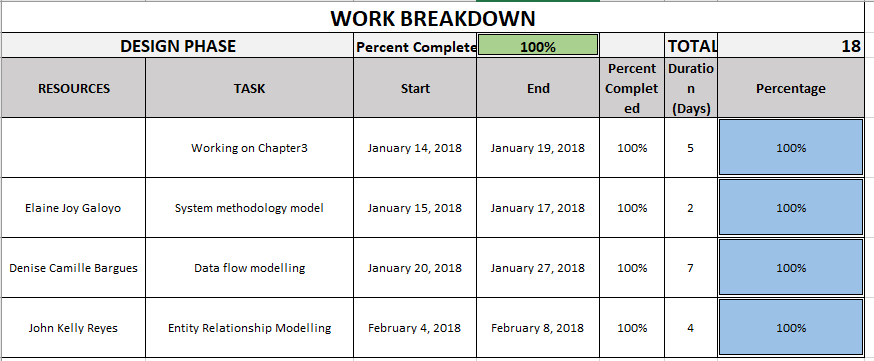
Figure 4.2: Design Phase
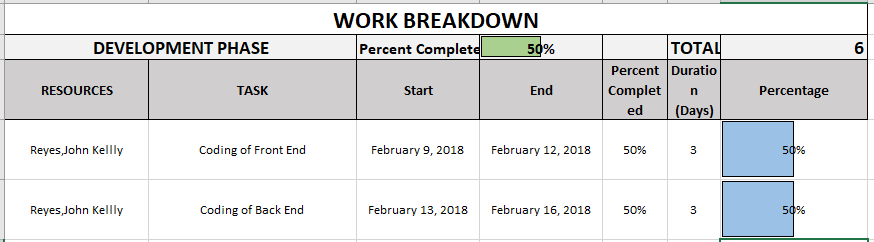
Figure 4.3: Development Phase
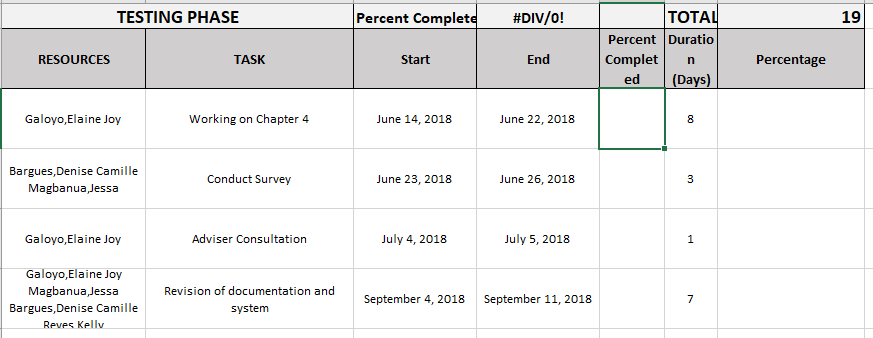
Figure 4.4: Testing Phase
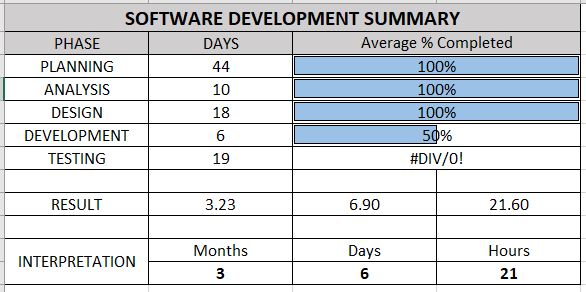
Figure 4.5: System Development Summary
Cost Benefit Analysis
| Development Cost | Quantity | Unit | No. of Months | Cost | Total Amount |
| Computers | 2 | SET | N/A | ₱ 25,000.00 | ₱ 50,000.00 |
| Programmer | 1 | N/A | 12 | ₱ 17,805.00 | ₱ 213,660.00 |
| Systems Analyst | 1 | N/A | 12 | ₱ 17,654.00 | ₱ 211,848.00 |
| User Interface Designer | 1 | N/A | 12 | ₱ 12,670.00 | ₱ 152,040.00 |
| Subtotal | ₱ 627,548.00 | ||||
Table 2.0: Developmental Cost
Cost benefits analysis or the CBA, is the estimated cost and sum of the amount cost and benefits of the system, to determine whether the college can gain benefit from the system.
| Operational Cost | Quantity | Unit | No. of Months | Cost | Total Amount |
| Electricity (Computers) | 1 | N/A | 12 | ₱ 317.85 | ₱ 3,814.20 |
| Internet Fee | 1 | N/A | 12 | ₱ 1,099.00 | ₱ 13,188.00 |
| Subtotal | ₱ 17,002.20 | ||||
Table 2.1: Operational Cost
| TOTAL COST | ₱ 644,550.20 |
This table shows the Operational cost of the researched system. The operational cost includes the maintenance cost and expenditures in using the researched system.
Table 2.2: Total Developmental Cost
| Benefit | Quantity | Unit | No. of Months | Cost | Total Amount |
| Data Backup | 1 | N/A | 12 | ₱ 1,700.00 | ₱ 20,400.00 |
| Security of Data | 1 | N/A | 12 | ₱ 21,250.00 | ₱ 255,000.00 |
| Accessibility | 1 | N/A | 12 | ₱ 5,120.00 | ₱ 61,440.00 |
| Efficiency of Work Output | 1 | N/A | 12 | ₱ 9,620.00 | ₱ 115,440.00 |
| TOTAL BENEFIT | ₱ 452,280.00 | ||||
This table shows the total amount of developmental and operational cost of the researched system.
Table 2.3: Benefits of the System
| Benefits of the System | Amount Value |
| Efficiency of work | ₱66,000.00 |
| Security of Data | ₱7,000.00 |
| Confidentiality of Data | ₱8,000.00 |
| Work Management of Data | ₱90,000.00 |
| Backup of Data | ₱7,000.00 |
| Ink | ₱3,500.00 |
| Bondpaper | ₱1,500.00 |
| Total | ₱183,000.00 |
This table shows the computed benefits of the researched system to
the school. The proponents have researched on what are the
presumed amounts or value of each item that will benefit the college
over its traditional method per year.
Cost Benefit Analysis
Table 2.4: Cost Benefit Analysis
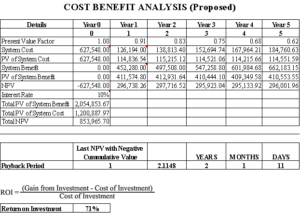
Table 3.4, shows a chart of the Cost and Benefits analysis. The Return of Investment comes out of 44%. The Payback Period was computed by taking the sum of the Present Value of system Benefit
(Php 411,574.80) subtracting it to the Present Value of System Cost
(Php 114,836.56) to get its Net Present Value and get the sum of Net Present Value (Php 296,738.26) subtracting it to the negative value of System cost (Php -627,548.00), and dividing the difference Net Present Value (Php296,738.26). Resulting to 2.1148 which is round to 2, making it a 2-year payback period. Payback period = Initial Investment/Cash Inflow. The ROI was computed by taking the sum of the Total Present Value of system benefits (Php 2,054,853.67), subtracting it to the Total Present Value of System Cost (Php 1,200,887.97), and dividing the difference Total Present Value of System Cost (Php 2,054,853.67). The quotient is Php 2,054,853.67 which is equivalent to 71% of ROI or Return of Investment. The formula that the proponents used can be seen on Table 3.4.
Use Case Diagram
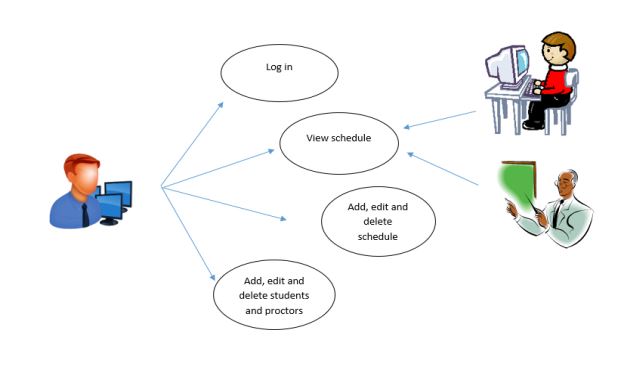
Figure 4 shows the activity of the admin and the authorized personnel in the system. The admin can access all the transactions that the system provides. Registered users have the privilege to view the system
Data Flow Diagram (Gane-Sarson)
The flow of the system begins when the admin generates the exam schedule. Next is to process teachers’ information. By the time that the reports are encoded, it will automatically be saved into the database. And then it can be viewed and printed.
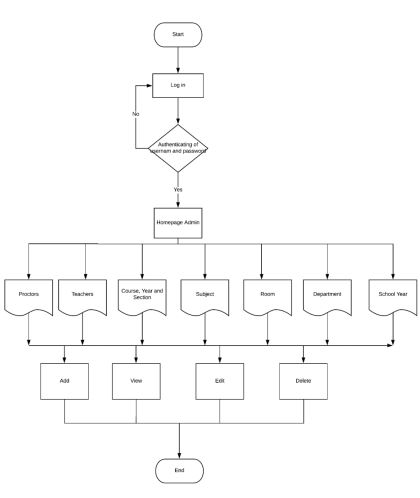
Figure 5: Data Flow Diagram of Online Exam Scheduling
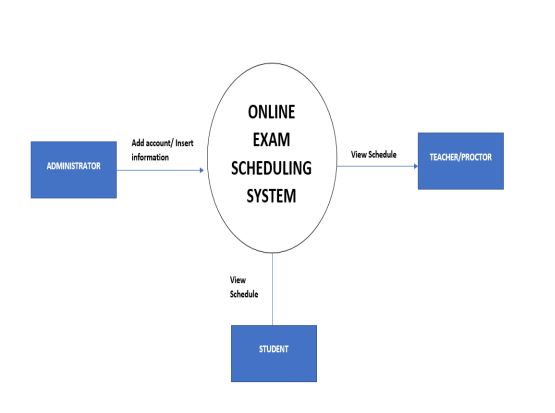
Context Diagram
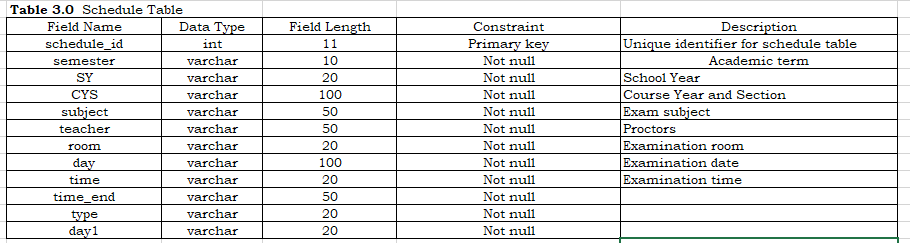
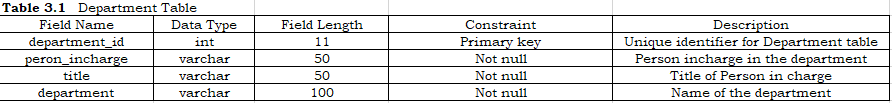
Database Dictionary
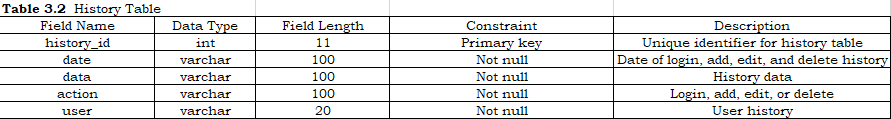

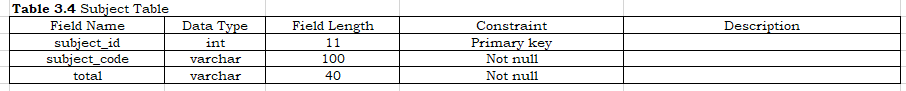

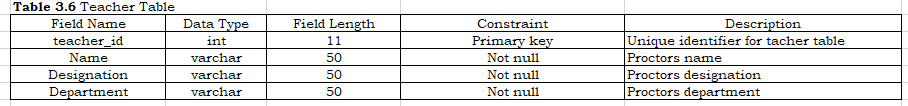


Entity Relationship Diagram
Entity Relationship Diagram explains every relationship between table’s entity and attributes. Each table has a definition that connects every table, both its primary key and foreign key. Use foreign key if the attributes of the one table have a unique id and foreign key will be identified when the other attributes are in the other table. Each attributes connects in performing every process.
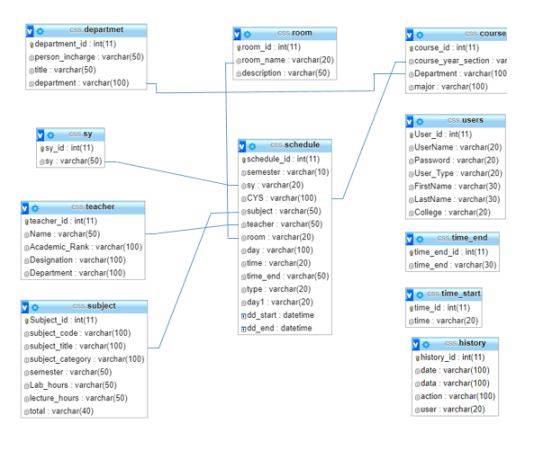
Figure 6: Entity Relationship Diagram of Online Exam Scheduling System
Presentation, Analysis And Interpretation Of Data
This chapter exhibits the results of the User’s Survey conducted for the system to ABC’s Teachers and Students
Presentation
The proponents demonstrate the system’s functionality to the randomly selected respondents. The proponents observed the respondents on how they response to the system. The respondents were evaluated using the User Acceptance Survey in order for the respondents to distinguish the level of acceptability of the proposed system.
Data Analysis
This section presents the analysis of the data collected and gathered from the respondents of ABC.
Characteristics of the Respondents
Table 4.0: Frequency of Respondents
| Respondents | Frequency |
| Deans’ office | 1 |
| Teachers | 10 |
| Students | 316 |
| Total | 327 |
The population is composed of the ABC administration and teachers and students. The proponents got 327 respondents from the colleges’ administration and students
Table 5.0 shows the number of respondents who have answered the User-Acceptability Survey. The researchers got a total number of 327 respondents.
Reliability Testing
The data collected by the proponents have undertaken reliability testing an acceptable approach through using the Yamanes Formula in order.
Yamanes Formula:
n = Sample size
N = Population size
e = level of precision 0.05 % (5%)
Solution:
This solution explains the summation of getting the sample size (n) of the population that will be taking the user acceptance survey. Where N=327 divided by 1+327 multiplied by 0.0025 as (e) or the level of precision. As the proponents gets the (e), it is divided to 327 as the total population size (N). The result was 180 for the sample size of the population (n).
Interpretation of Data
Table 5.1: Interpretation of data
| Range Of Mean | Verbal Interpretation |
| 4.21-5.00 | Very Satisfied |
| 3.41-4.20 | Satisfied |
| 1.81-2.60 | Dissatisfied |
| 1.00-1.80 | Very Dissatisfied |
The instrument wished to access the perception of the users in terms of five (5) categories namely: Effectiveness, Efficiency, Quality, Timeliness and Productivity. The first category was composed of four (4) items, the second category was composed of three (3) items, and the third, fourth and last categories were composed of four (4) items. Table 5.6 shows that the user’s survey result for the system’s quality came back with a total mean of 3.88 which interpret that the users were very satisfied with the system’s quality after testing it.
Effectiveness
Table 5.2: Survey Result – Effectiveness
| System Quality Performance | Total Mean | Verbal Interpretation |
| Effectiveness | 4.47 | Very Satisfied |
Table 5.2 shows that the user’s survey result for the effectiveness of the system came back with a total mean of 4.5 which interpret that the users were very satisfied with the system’s effectiveness after testing it.
The respondents stated that the proposed system (OESS) meet the desired result and it produced the desired output. They also stated that the system is effective, it means it has an intended or expected outcome.
Efficiency
Table 5.3: Survey Result – Efficiency
| System Quality Performance | Total Mean | Verbal Interpretation |
| Efficiency | 4.4302 | Very Satisfied |
Table 5.3 shows that the users survey result for the system’s efficiency came back with a total mean of 4.4 which interpret that the users were satisfied with the efficiency of the system after testing it.
Quality
Table 5.4: Survey Result – Quality
| System Quality Performance | Total Mean | Verbal Interpretation |
| Quality | 4.4419 | Very Satisfied |
Table 5.4 shows that the user’s survey result for the system’s quality came back with a total mean of 4.4 which interpret that the users were satisfied with the system’s quality after testing it.
Timeliness
Table 5.5: Survey Result – Timeliness
| System Quality Performance | Total Mean | Verbal Interpretation |
| Timeliness | 4.4243 | Very Satisfied |
Table 5.5 shows that the user’s survey result for the system’s quality came back with a total mean of 4.4 which interpret that the users were satisfied with the system’s quality after testing it.
Productivity
Table 5.6: Survey Result – Productivity
| System Quality Performance | Total Mean | Verbal Interpretation |
| Productivity | 4.4342 | Very Satisfied |
Table 5.6 shows that the user’s survey result for the system’s quality came back with a total mean of 4.4342 which interpret that the users were very satisfied with the system’s quality after testing it.
The respondents stated that the system (OEIS) has the ability to produce a desired result. They measured the ratio of output to inputs used in a production process, i.e. output per unit of input.
System Satisfaction
Table 5.7 Survey Results – System Satisfaction
| System Quality Performance | Total Mean | Verbal Interpretation |
| System Satisfaction | 4.4403 | Very Satisfied |
Table 5.7 shows that the user’s survey result for the system’s satisfaction came back with a total mean of 4.4403 which interpret that the users were very satisfied with the system’s quality after testing it.
Overall
Table 5.8 Survey Results – Overall
| System Quality Performance | Total Mean | Verbal Interpretation |
| Overall | 4.4403 | Very Satisfied |
Summary Of Findings, Conclusions And Recommendations
This chapter presents the summary of the findings, and the conclusions and the recommendations for the system study.
Summary of Findings
This study was conducted for the purpose of making an Online Exam Schedule Viewer, to make everything easier for both teachers and students which can lead to productivity. It can save time for both students and teacher which can lead to productivity. The descriptive method of research was utilized and the survey technique was used for gathering date. A questionnaire served as an instrument for the collection of data.
The proponents conducted a survey to thee students, some of the teachers and the Dean’s office. The survey was conducted after system had all the requirements, functionalities and feature embedded.
The findings suggested that on the level of user’s experience in the terms of effectiveness, efficiency, quality, timeliness, productivity has all gathered the mean of 4.4 which all ranked as “very satisfied”. As well as the System Satisfactory also has a mean of 4.4401 which is identified as “very satisfied”. And the overall has a mean of 4.4403 that is also identified as “very satisfied”.
Conclusion
The proponents conclude that the existing manual exam scheduling system must be upgraded to automated system. The new system can be concluded to be more responsive to the needs of the scheduling concerns of the college; more effective and efficient means of preparing schedules; can immediately detect errors; can monitor class occupancy and vacancy; and, is more secured from data loss
Recommendation
As the proponents had made an information system for the school, the system shall have maintenance every 6-8 months to maintain and update its’ functions.
References
https://www.collinsdictionary.com/dictionary/english/date
https://www.collinsdictionary.com/dictionary/english/time
https://www.collinsdictionary.com/dictionary/english/units
https://www.collinsdictionary.com/dictionary/english/teacher
https://www.collinsdictionary.com/dictionary/english/proctor
http://thesisworks.com/2011/it-thesis/related-studies-faculty-loading/
http://www.academia.edu/9162628/Chapter_2_Review_of_Related_Literature_and_Studies
https://techspirited.com/modified-waterfall-model
https://www.theserverside.com/definition/HTML-Hypertext-Markup-Language
https://en.wikipedia.org/wiki/Cascading_Style_Sheets
https://whatis.techtarget.com/definition/PHP-Hypertext-Preprocessor
Leave A Comment
You must be logged in to post a comment.