Application System Capstone Project Document
Introduction
In business industry today it has many strategic that is formulating by managers to make one of the business grow and become successful and as an information system students conduct some study on Nana’s Cake Gallery to help them advertised their business. And it is also one of the reasons why the proponents proposed to them the Nana’s Mobile App, it is a system that could help them to promote their business online and it could also help them to have an online customers.
According to Nicole Pontius, Businesses and organization of all sizes must manage, control, and track inventory at anytime and from anywhere. Today, inventory management is even crucial to success and sustainability, as business transactions take place on a global scale and cover multiple locations. Manually entering, tracking, and counting inventory management, control and tracking methods solely on desktop computer is no longer feasible.
So, technology companies and firms have designed and developed inventory management, control, and tracking apps to make inventory data entry, search, and visualization possible from any location and anytime using smartphones and tablets. Hundreds of inventory management, control, and tracking apps are available for IOS and Android devices, and we have chosen our top 30 apps based on their integration, scanning, and ease-of-use capabilities.
Background of the Study
Nana’s Cake Gallery and Bakery, is the newest source of delicious custom cakes, cupcakes and cookies in Bacolod City. Nana’s Cake Gallery and Bakery have three branches, which are located in Binalbagan, Carlos Hilado and B.S. Aquino Drive. This study made for Nana’s Cake Gallery and Bakery is one way of enhancing the business competitively these days. The purpose of this study is to serve Nana’s Cake Gallery and Bakery valued customers convenience, enjoyment and satisfaction with a fast and timely service. Nana’s Cake Gallery and Bakery is still using manual system that makes some circumstances lost and misplaced of important records that makes business behind from its competitors. Today’s generation rely on technology such as e-commerce to provide their needs. In one way or another technology makes Nana’s Cake Gallery and Bakery more competitive to its competitors. Through this technology Nana’s Cake Gallery and Bakery become more productive, increase in sales and can cater a wide range of customer. Nowadays online business becomes more convenient to people. Applying this technology to Nanas Cake Gallery and Bakery will assure its success and a caliber service provider to the community.
Objective of the Study
The main objective of this study will provide Nana’s Cake Gallery & Bakery in their product transaction and management.
- The proposed system aims to design and develop a mobile application and a web-based system for Nana’s Cake & Bakery that will:
- Allow ordering and purchase of products online.
- Generate sales report Nana’s Cake Gallery and Bakery daily weekly, monthly, and yearly sales.
- Compute and update sales and purchases electronically.
- Track customer’s order.
- Manage admin and user accounts.
- Evaluate the system using ISO 9126 standard.
Scope and Delimitation of the Study
The scope of this study is to build an ecommerce website with android app that will help customers and management convenience. This study covers the product-based project involving the application of software to analyze, design and develop a piece of software to address the present need of the Shop. The customer can have their orders on delivery at the front of their house with less than an hour. The company can see and update the inventory and the orders of the customers. The researchers include the click and collect, the categories of the product, cash on delivery mode of payment, auto filled forms and the minimal pinching and zooming.
The system does not include the bank to bank transaction, the sales of the company, the personal information of the customer and other features that is too hard to understand.
Significance of the study
The system made for Nana’s cake gallery and bakery will beneficial to the following groups:
For the customers
They can easily:
- Register to the Website using PC or Mobile
- Placed order products via PC and mobile or through its company ecommerce website.
- Can Choose Delivery or Pick-up Mode
For the company
- Manage admin and user accounts.
- Speed up the process placed order.
- Provide accurate and detailed sales report.
- Manage admin and user accounts.
- Maintain Shop reports
Future Researches
They can use this study to widen and enlighten them for their research.
Definition of the Terms
Android Mobile Application
– An Android app is a software application running on the Android platform. Because the Android platform is built for mobile devices, a typical Android app is designed for a smartphone or a tablet PC running on the Android OS. (https://www.techopedia.com/definition/25099/android-app)
– computer program that runs to your gadget.
Electronic Commerce
– E-commerce is a transaction of buying or selling online. Electronic commerce typically uses the World Wide Web for at least one part of the transaction’s life cycle although it may also use other technologies such as e-mail. (https://en.wikipedia.org/wiki/E-commerce )
– activities that relate to the buying and selling of goods and services through internet.
Database
– is a collection of information that is organized so that it can be easily accessed, managed and updated. Data is organized into rows, columns and tables, and it is indexed to make it easier to find relevant information. (http://searchsqlserver.techtarget.com/definition/database )
- Stack of information.
Transaction
– is an agreement between a buyer and a seller to exchange goods, services or financial instruments. (http://www.investopedia.com/terms/t/transaction.asp )
– It is dealing with business of two parties or more.
Review of Related Literature
In this chapter the proponents discuss the related studies of the local and foreign literature that used the same system.
Foreign studies:
McDonalds
The purpose of this project is to develop a computerized and mobilized food ordering system that can be used to revolutionize the traditional ordering system that currently implemented in majority of the food and beverage industry. The traditional system that using by most of the food and beverage industry is the traditional manual ordering system which means all works and procedures is recorded through manpower manual work and it consist of a huge amount of paperwork that is not effective and efficiency. This cause the business to encounter trouble which regarding human error due to the huge amount of manpower manual work that operating in each business routine. Thus, this computerized and mobilized food ordering system is designed to assist the business routine in term of having better management as well as easier to handle daily business operation.
This system is designed for small medium enterprise food and beverage industry. The chosen methodology for this project is throwaway prototyping methodology. This is because majority of the targeted user do not have the experience in using computerized system in food ordering procedure as they implement traditional ordering system previously. Therefore, this methodology enables developer to communicate with target user through using the prototyping, which can let target user to review, evaluate, visualize and learn about the system before the actual implementation of the final system.
Furthermore, the system is a cross platform system which involve desktop based and mobile phone based which is in Android operating system. It is also the highlighted feature of the system which does not limit the ordering procedures to desktop based as portable and mobility is the current trend. Besides that, with this feature it also provide a degree of level of self service for targeted users’ consumers, as they can place order themselves through using the mobile application.
(Ray Kroc, 1955)
Krispy Kreme
Krispy Kreme is a famous chain of donut and coffee store all around the world. In 1937, Vernon Rudolph founded Krispy Kreme in Winston-Salem. Since then Krispy Kreme’s mission has been to provide the best service and highest-quality products to customers. At first, Vernon Rudolph started his business by selling donut to other stores. But in 1938, he opened the first Krispy Kreme store in Winston-Salem and began to sell donuts to customers. Today, Krispy Kreme grows rapidly in international business with the opening of a lot of stores in Australia, United Kingdom, Asia and Middle East… not to mention its franchise expansions.
Krispy Kreme is a major competitor in restaurant industry, well-known for its doughnuts. But by 2006, Krispy Kreme’s net loss was about $135.8 million and in 2007 it had cut back to 299 stores compared to 366 stores in 1990s. Krispy Kreme attribute the problems were low-carbohydrate and low-fat diets. A diet is external environment problem that still effect to Krispy Kreme today. Krispy Kreme’s core product – Original Glazed doughnuts – unfortunately is very high-carbohydrate, reverse with customers demand of low-carb food. Even Krispy Kreme can see the problem about low-carb foods, they cannot change their technology to make healthier doughnuts because if they do that, their doughnuts won’t have original taste anymore and can hurt their business even further.
(UK Essays, July 2017)
Local Studies:
Xin Chao Interactive Restaurant Menu: An Android Based Application
As a primary tool for sales and communication in a restaurant operation, the study involved the application of technology in innovating traditional paper menu of the Xin Chao Vietnamese restaurant located at High Strip 4, Circumferential Road Bacolod City into an interactive digital menu. In the course of the operation, the manual system of Xin Chao faces some problems such as delays in order taking, thus delay on the delivery of the ordered food. There are also times that wrong orders are given to the customers due to human communication errors. Due to this unorganized ordering system, the restaurant lost many of its customers leading them to close the establishment several times. (Mariano S., et. al., 2014).
Jollibee Foods Corporation
Jollibee Foods Corporation (JFC) is the Philippines’ largest Food Service business and is continuously expanding its presence in foreign countries. It has a System Wide Sales of P117.9 billion and a Net Income of P5.4 billion in 2014.
JFC has a total store network of 2,951 stores worldwide as of
March 31, 2015. In the Philippines, JFC’s store network totals to 2,335: Jollibee brand 869, Greenwich 216, Chowking 419, Red Ribbon 334, Mang Inasal 452, and Burger King 45. Abroad, it operates 616 stores: Yonghe King 313, Hong Zhuang Yuan 43, and San Pin Wang, 53, all in China, Jollibee 123 (USA 32, Vietnam 60, Brunei 12, Saudi Arabia 10, Qatar 3, Kuwait 3, Singapore 2 and Hong Kong 1), Chowking 47 (US 19, UAE 20, Qatar 5, Oman 2 and Kuwait 1), Red Ribbon US 34 and Jinja Bar US 3.
JFC also has a 50% share in joint ventures for the following stores: Highlands Coffee (Philippines, Vietnam) 77, Pho 24 (Vietnam, Indonesia, Philippines, Cambodia, Macau and Korea) 45, and 12 Sabu (China) 20.
JFC also operates commissaries or manufacturing plants to support the continued growth of its retail chain. It has 12 commissaries and a distribution center in the Philippines. Abroad, it has 3 commissaries in China, 3 in the United States and 1 in Vietnam.
JFC is also committed to serve its host communities through socio-civic projects through the Jollibee Group Foundation. The foundation has focused its work on feeding programs for undernourished children in poor communities, developing farmers to become better entrepreneurs and suppliers of agricultural products and providing disaster relief for calamity-stricken regions.
Jollibee Foods Corporation has grown brands that bring delightful dining experience to its customers worldwide, “Spreading the joy of eating to everyone.”
Jollibee Foods Corporation (“JFC” or the “Company”) core business is the development, operation and franchising of its quick-service restaurant brands. It offers a wide variety of affordable and delicious dishes and great tasting food prepared to satisfy customers of all ages and from all walks of life.
Food quality, service, price-value relationship, store location and ambience, and efficient operations continue to be critical elements of the Company’s success in the quick-service restaurant industry.
(© 2017 Jollibee Foods Corporation.
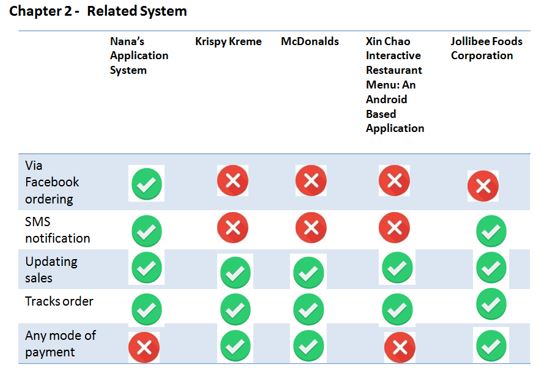
Related System
Synthesis
The studies that are mentioned above, local and foreign, they both have same objectives to help the consumers like mostly the people nowadays are techie so it would be more convenient for the customers. Some of the systems above have features that ours don’t have such as bank to bank transaction. Buying and selling goods and services online through gadgets and promoting this mobile application will introduce the shop to a lot of consumers.
Methodology
This chapter will show how the system flows and the phases it goes through. This chapter will also discuss the function of the
different components of the system.
The Standard development life cycle or SDLC is a process used by software industry to design, develop and test high quality software.
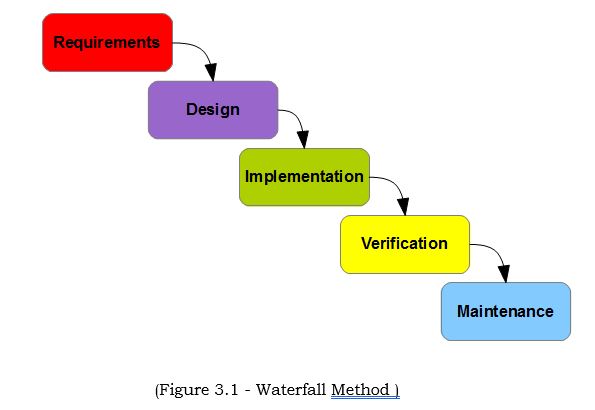
The researchers decided to use the waterfall model because it is the one that widely used process for software engineering. The researchers will gather enough data through interviews and will complete the requirements of the system. The information collected will give coverage regarding to what the scope of the system should cover. The researchers have decided to use waterfall method because it is the most widely used process. This chapter will also showcase the tools, phases, tasks and techniques.
Modified Waterfall Method
The Modified Waterfall Method is a sequential repetitive design process, used in software development processes, in which the progress is seen as flowing steadily downwards but you can repeat or enhance a process if it has errors.
Phases
Planning Phase
The project started by finding a suitable company and finding the lack of needs of that company. Then the proponents will conduct an study. The proponents propose titles to the panelist. The proponents determined that in order to meet the need of the client or the organization.
Analysis Phase
After the proponents proposed the title to the panelist. They analyze their study and arranged the title according to their prioritized system. And in this phase they used the interview method to gather data information from the company.
Design Phase
In this phase the proponents will suggest and think of desired outcome with matching its appropriate color scheme and the company’s logo accordingly.
Development Phase
This phase after the proponents gathered those requirements that are analyzed, the proponents made a simple design and this design can be upgraded and developed that can be very useful in the future. This phase is where the actual coding started.
Testing Phase
In this phase the proponents invited the organization and various respected people to test the effectiveness of the system. In this stage test also the standard or the quality of the system.
Implementation Phase
After the testing phase where the system is proven that is effective and efficient unlike the current system that they used. This would be the time that the system would be implemented on the company.
Maintenance Phase
In this phase is the last part of SDLC this stage is the time that the system will be updated or upgraded by the company wants. The system required maintenance in order to keep the system functionalities.
User Acceptance Survey
The developed system underwent user acceptance testing by the user of the system which include the customers and the client. This system will target the customers in a way that they can order the product easily. And it would benefits the company for the higher sales of this business and helped their business advertise.
Requirement Specifications
- Operational Feasibility
The Nana’s Application System can help the company by the online ordering and the automated inventory.
Program Environment
Front End
MySql – database that used to track and add the orders of the customers. And the customer details, product, category, price, quantity and other details are also there.
Back End
JavaScript – help the codes to function the system that we made if there’s no codes for the javascript we weren’t able to start the system.
PHP (HYPERTEXT PROCESSOR) – is a widely-used open source general-purpose scripting language that is especially suited for web development and can be embedded into HTML.
CSS – this helped the design for the android application. And it is easy to design and connect to database.
Technical Feasibility
Hardware Requirement
PC
- Intel Celeron
- 1GB RAM
- QuadCore
Smartphone
- Android OS Version (KITKAT and higher version)
Software Requirement
- Operating system (Window 7,10)
- Web browser(Chrome, Firefox)
- Internet connection
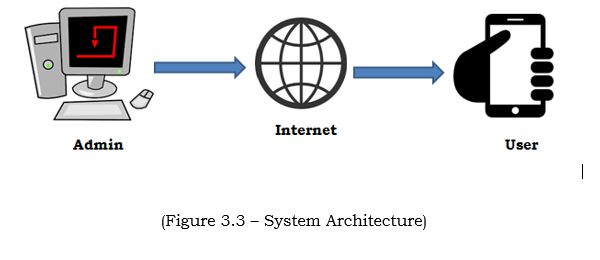
System Architecture
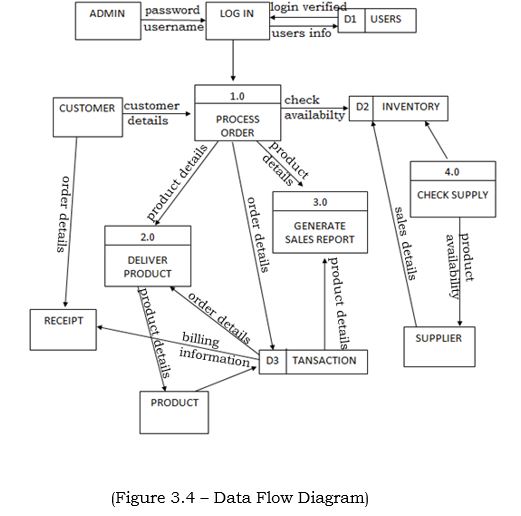
Data Flow Diagram
The figure shows the customer Data Flow Diagram for Nana’s Application System. The diagram represents the processes to transact with the customer faster. The system first verifies the customer’s login. The customer can directly check the availability of the product and pick the desired product in the home page then put the product that chose to the shopping cart.
| Developmental
Cost |
Duration | Monthly Cost | Total
Amount |
| Programmer | 6 months | Php 4500.00 | Php 27000 |
| System Analyst | 6 months | 5,500.00 | 33000 |
| Project Manager | 6 months | 6500.00 | 39000 |
| Office Supplies | 6 months | 150.00 | 900 |
| Internet Fee | 6 months | 1500.00 | 9000 |
| Electricity | 6 months | 240.00 | 1440 |
COST BENEFIT ANALYSIS
(Figure 3.5 – Cost Benefit Analysis)
Use Case Diagram
Use Case Diagram
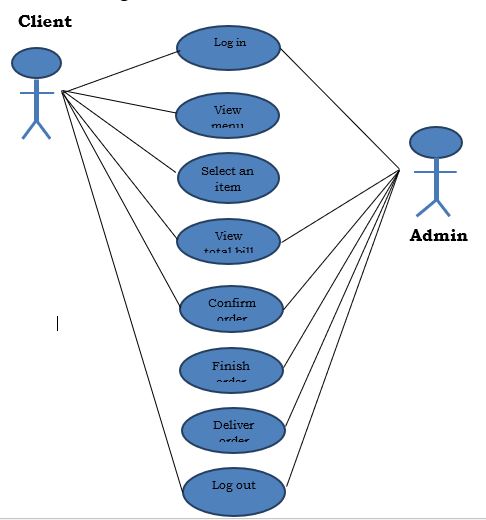
The figure shows the access of the admin and the client. The admin has full access to the system, some of the function that the admin can utilize: view the total bill, confirming the order, delivering the order of the client. The customer has utilize the following transactions: register, customer Login/logout, browse products, manage shopping cart.
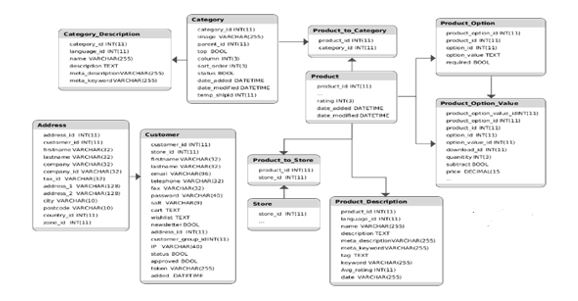
Er Diagram
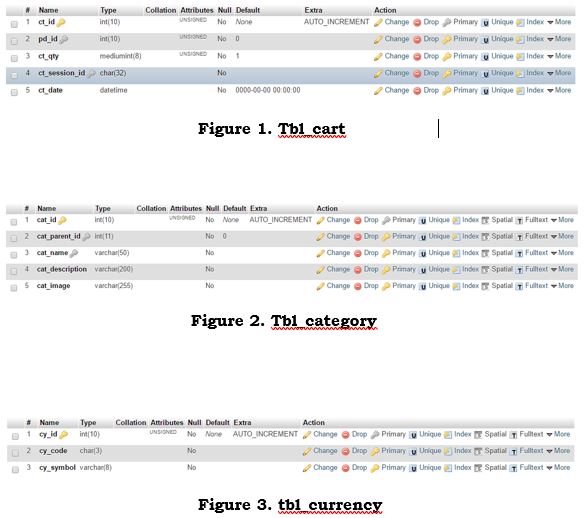
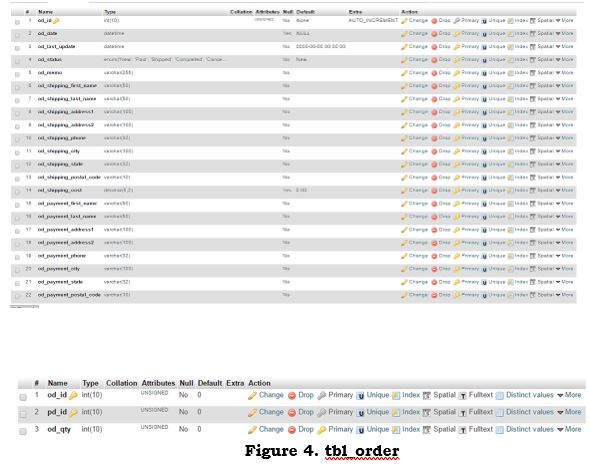
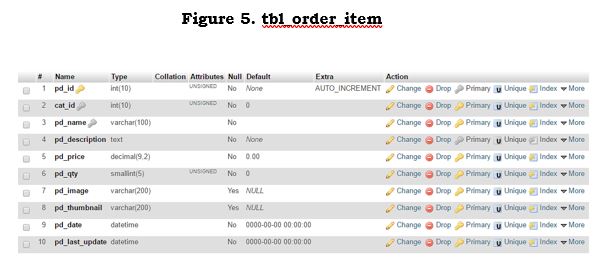
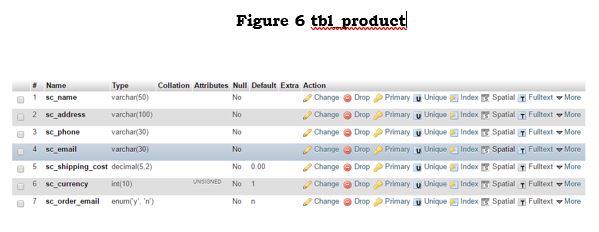
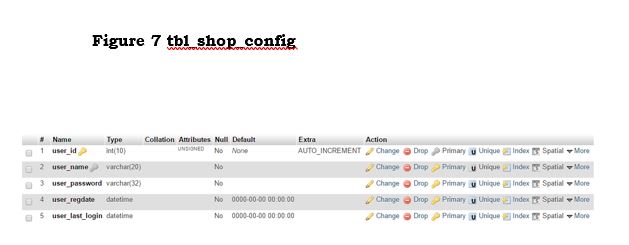
Data Dictionary
Presentation
The Proponents of Nana’s Application System conducted a survey to selected customers. The following customers of Nana’s Cake Gallery and Bakery. This include the testing of the system as well as the proponents have the demonstrated to the respondents the effectiveness of the system. By considering this, the proponents have observed on how the respondent will react. The selected respondents were evaluated using the user acceptance.
Data Analysis
The Data Analysis Survey activities will prevent the existing data that have been stack up together by the proponents from various respondents using the User Acceptance Survey.
Characteristic of Respondents
The population of this evaluation regarding to Nanas Application System composed of the customers and the employees of Nanas Cake Gallery and Bakery. The proponent gathered 50 respondents in relation to the system.
Reliability Testing
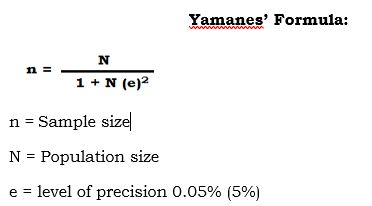
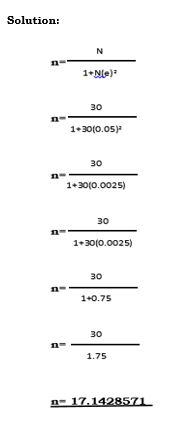
The data collected by the proponents have undertaken reliability testing. An acceptable approach through using the Yamanes Formula in order to identify the sample size of population that will undergo the user acceptance survey.
This solution explains the summation of getting the sample size (n) of the population that will be taking the user acceptance survey. Where n=30 divided by 1+30 multiplied by 0.75 as (e) or the level of precision. As the proponents gets the (e), it is divided to 30 as the total population size (N). The result was 17.1428571 for the sample size of the population (n).
Interpretation of Data
The proponent of Nanas Application System conducted an observation which evaluates the responses of the user in the division of five (5) user’ acceptability categories. These categories namely Effectively, Effeciency, Quality, Timelines and Productivity, in each category consist a linear scale that rates from 1 as very dissatisfied, 2 as dissatisfied, 3as neutral, 4 as satisfied, 5 as very satisfied. The first category .
| Range: | Verbal Interpretation |
| 4.21-5.00 | Very Satisfied |
| 3.42-4.2 | Satisfied |
| 2.61-3.40 | Neutral |
| 1.81- 2.60 | Disastified |
| RESPONDENT SURVEY RECORD | ||||||||||||||||||||||||||
| Effectiveness | Efficiency | Quality | Timeliness | Productivity | ||||||||||||||||||||||
| Q1 | Q2 | Q3 | Q4 | Tol | Q1 | Q1 | Q1 | Tol | Q1 | Q1 | Q1 | Q1 | tol | Q1 | Q1 | Q1 | Q1 | Tol | Q1 | Q1 | Q1 | Q1 | Tol | |||
| Cust_1 | 4 | 3 | 4 | 4 | 3.75 | 4 | 4 | 4 | 4 | 4 | 4 | 5 | 4 | 4.25 | 4 | 4 | 4 | 3 | 3.75 | 4 | 4 | 5 | 5 | 4.5 | ||
| Cust2 | 3 | 3 | 4 | 3 | 3.75 | 5 | 3 | 4 | 4 | 4 | 3 | 4 | 4 | 3.75 | 4 | 3 | 4 | 4 | 3.75 | 4 | 3 | 4 | 4 | 3.75 | ||
| Cust3 | 4 | 4 | 3 | 4 | 3.75 | 4 | 4 | 3 | 3.6 | 4 | 3 | 4 | 4 | 3.75 | 4 | 3 | 3 | 4 | 2.5 | 3 | 3 | 4 | 4 | 2.5 | ||
| Cust4 | 4 | 3 | 4 | 4 | 3.75 | 4 | 4 | 4 | 4 | 4 | 4 | 5 | 4 | 4.25 | 4 | 4 | 4 | 3 | 3.75 | 4 | 4 | 5 | 5 | 4.5 | ||
| Cust5 | 4 | 3 | 4 | 3 | 3.5. | 3 | 4 | 4 | 3.6 | 4 | 4 | 4 | 5 | 4.25 | 4 | 4 | 3 | 4 | 3.75 | 4 | 4 | 4 | 3 | 3.75 | ||
| Cust6 | 4 | 3 | 4 | 4 | 3.75 | 4 | 4 | 3 | 3.6 | 5 | 4 | 3 | 4 | 4 | 3 | 4 | 4 | 3 | 3.5 | 3 | 4 | 4 | 3 | 3.5 | ||
| Cust7 | 4 | 4 | 5 | 4 | 4.25 | 5 | 4 | 4 | 4.3 | 4 | 4 | 3 | 4 | 3.75 | 3 | 4 | 4 | 3 | 2.5 | 4 | 4 | 4 | 4 | 4 | ||
| Cust8 | 3 | 4 | 4 | 4 | 3.75 | 5 | 3 | 4 | 4 | 4 | 4 | 4 | 4 | 4 | 3 | 4 | 3 | 4 | 3.5 | 4 | 4 | 4 | 4 | 4 | ||
| Cust9 | 4 | 4 | 4 | 4 | 4 | 5 | 4 | 4 | 4.3 | 4 | 4 | 3 | 4 | 3.5 | 4 | 4 | 3 | 4 | 3.5 | 4 | 4 | 4 | 4 | 4 | ||
| Cust
10 |
4 | 4 | 4 | 4 | 4 | 5 | 4 | 4 | 4.3 | 5 | 4 | 4 | 5 | 4.5 | 4 | 4 | 3 | 4 | 3.75 | 4 | 4 | 4 | 4 | 4 | ||
| Cust
11 |
3 | 4 | 3 | 4 | 3.5 | 3 | 3 | 3 | 3 | 3 | 3 | 3 | 4 | 3.25 | 4 | 4 | 4 | 3 | 3.75 | 3 | 3 | 3 | 4 | 3.25 | ||
| Cust
12 |
4 | 3 | 4 | 4 | 3.75 | 5 | 4 | 3 | 4 | 3 | 4 | 4 | 4 | 3.75 | 4 | 4 | 5 | 4 | 4.25 | 4 | 4 | 5 | 4 | 4.25 | ||
| Cust
13 |
4 | 4 | 5 | 4 | 4.25 | 4 | 4 | 5 | 4.3 | 4 | 4 | 3 | 4 | 3.75 | 3 | 4 | 4 | 4 | 3.75 | 4 | 3 | 4 | 5 | 4 | ||
| Cust
14 |
4 | 4 | 4 | 5 | 4.25 | 5 | 4 | 4 | 4.3 | 4 | 4 | 4 | 5 | 4.25. | 4 | 4 | 5 | 4 | 4.25 | 4 | 4 | 4 | 4 | 4 | ||
| Cust
15 |
3 | 4 | 3 | 4 | 3.5 | 3 | 4 | 3 | 3.3 | 4 | 3 | 3 | 4 | 3.5 | 3 | 3 | 4 | 3 | 3.25 | 3 | 4 | 3 | 4 | 3.5 | ||
Table 3
| Effectiveness | Efficiency | Quality | Timeliness | Productivity | |||||||||||||||||||||
| Q1 | Q2 | Q3 | Q4 | Tol | Q1 | Q1 | Q1 | Tol | Q1 | Q1 | Q1 | Q1 | tol | Q1 | Q1 | Q1 | Q1 | Tol | Q1 | Q1 | Q1 | Q1 | |||
| Cust_16 | 4 | 3 | 4 | 4 | 3.75 | 4 | 4 | 4 | 4 | 4 | 4 | 5 | 4 | 4.25 | 4 | 4 | 4 | 3 | 3.75 | 4 | 4 | 5 | 5 | ||
| Cust
17 |
3 | 3 | 4 | 3 | 3.75 | 5 | 3 | 4 | 4 | 4 | 3 | 4 | 4 | 3.75 | 4 | 3 | 4 | 4 | 3.75 | 4 | 3 | 4 | 4 | ||
| Cust
18 |
4 | 4 | 3 | 4 | 3.75 | 4 | 4 | 3 | 3.6 | 4 | 3 | 4 | 4 | 3.75 | 4 | 3 | 3 | 4 | 2.5 | 3 | 3 | 4 | 4 | ||
| Cust
19 |
4 | 3 | 4 | 4 | 3.75 | 4 | 4 | 4 | 4 | 4 | 4 | 5 | 4 | 4.25 | 4 | 4 | 4 | 3 | 3.75 | 4 | 4 | 5 | 5 | ||
| Cust
20 |
4 | 3 | 4 | 3 | 3.5. | 3 | 4 | 4 | 3.6 | 4 | 4 | 4 | 5 | 4.25 | 4 | 4 | 3 | 4 | 3.75 | 4 | 4 | 4 | 3 | ||
| Cust
21 |
4 | 3 | 4 | 4 | 3.75 | 4 | 4 | 3 | 3.6 | 5 | 4 | 3 | 4 | 4 | 3 | 4 | 4 | 3 | 3.5 | 3 | 4 | 4 | 3 | ||
| Cust
22 |
4 | 4 | 5 | 4 | 4.25 | 5 | 4 | 4 | 4.3 | 4 | 4 | 3 | 4 | 3.75 | 3 | 4 | 4 | 3 | 2.5 | 4 | 4 | 4 | 4 | ||
| Cust
23 |
3 | 4 | 4 | 4 | 3.75 | 5 | 3 | 4 | 4 | 4 | 4 | 4 | 4 | 4 | 3 | 4 | 3 | 4 | 3.5 | 4 | 4 | 4 | 4 | ||
| Cust
24 |
4 | 4 | 4 | 4 | 4 | 5 | 4 | 4 | 4.3 | 4 | 4 | 3 | 4 | 3.5 | 4 | 4 | 3 | 4 | 3.5 | 4 | 4 | 4 | 4 | ||
| Cust
25 |
4 | 4 | 4 | 4 | 4 | 5 | 4 | 4 | 4.3 | 5 | 4 | 4 | 5 | 4.5 | 4 | 4 | 3 | 4 | 3.75 | 4 | 4 | 4 | 4 | ||
| Cust
26 |
3 | 4 | 3 | 4 | 3.5 | 3 | 3 | 3 | 3 | 3 | 3 | 3 | 4 | 3.25 | 4 | 4 | 4 | 3 | 3.75 | 3 | 3 | 3 | 4 | ||
| Cust
27 |
4 | 3 | 4 | 4 | 3.75 | 5 | 4 | 3 | 4 | 3 | 4 | 4 | 4 | 3.75 | 4 | 4 | 5 | 4 | 4.25 | 4 | 4 | 5 | 4 | ||
| Cust
28 |
4 | 4 | 5 | 4 | 4.25 | 4 | 4 | 5 | 4.3 | 4 | 4 | 3 | 4 | 3.75 | 3 | 4 | 4 | 4 | 3.75 | 4 | 3 | 4 | 5 | ||
| Cust
29 |
4 | 4 | 4 | 5 | 4.25 | 5 | 4 | 4 | 4.3 | 4 | 4 | 4 | 5 | 4.25. | 4 | 4 | 5 | 4 | 4.25 | 4 | 4 | 4 | 4 | ||
| Cust
30 |
3 | 4 | 3 | 4 | 3.5 | 3 | 4 | 3 | 3.3 | 4 | 3 | 3 | 4 | 3.5 | 3 | 3 | 4 | 3 | 3.25 | 3 | 4 | 3 | 4 | ||
Respondents Survey
This shows the result of user acceptance survey in which so respondents were tested, where every category were computed. Each of the computed averages was presented through tables below to precisely showcase each categories mean.
| Effectiveness | |||||
| Question 1 | Question 2 | Question 3 | Question 4 | Total | |
| Mean | |||||
Survey Result – Effectiveness
This table shows that the user survey result for the effectiveness of the system came back with a total mean of 3.775 interpreted that the client were satisfied with the system’s effectiveness after they were testing it.
| Efficiency | ||||
| Question 1 | Question 2 | Question 3 | Total | |
| Mean | ||||
Survey Result – Efficiency
This table shows that the user survey result for the efficiency of the system came back with a total mean of 4.2 which reads that the client were satisfied with the system’s efficiency after they were testing it.
| Quality | |||||
| Question 1 | Question 2 | Question 3 | Question 4 | Total | |
| Mean | |||||
Survey Result – Quality
This table shows that the user survey result for the quality of the system came back with a total mean of 4.225 which reads that the client were satisfied with the system’s quality after testing it.
| Timeliness | |||||
| Question 1 | Question 2 | Question 3 | Question 4 | Total | |
| Mean | |||||
Survey Result – Timeliness
This table shows that the user survey result for the timeliness of the system came back with a total mean of 3.875 which reads that the client were satisfied with the system’s timeliness after testing it.
| Productivity | |||||
| Question 1 | Question 2 | Question 3 | Question 4 | Total | |
| Mean | |||||
Survey Result – Productivity
This table shows that the user result for the productivity of the system came back with a total mean of 4.375 which reads that the client were satisfied with the system’s efficiency after they were testing it.
Summary, Conclusion And Recommendation
This chapter present the summary of the study, the conclusion and the recommendation based on the findings of the researches.
Summary
Nana’s Application System of the Nana’s Cake Gallery and Bakery is developed to provide solutions to the concerns of the shop. The person who will handle and run the system should be knowledgeable and well acquainted with the system. The employees should be cultivated about the functions of the system. The Nanas Application System needs a browser, a xampp application to run the system. The system needs wifi to make a connection by using IP address.
Conclusion
The system is useful for the company, it provides the efficiency of generating and updating sales report. It will lessen the manual work of the employee for the reports and the sales.
Recommendations
The system, which is automated system that is applicable in any devices. The system is came up because of the manual type of updating generating sales report and the manual ordering way of the company. Based on the problems that the proponents gathered, the system is the way to solve the problem by using the manual system.
Based on the previous tables from the survey result in 5 categories the proponents conclude that is rated as 4.09 interpreted as satisfied.



Leave A Comment
You must be logged in to post a comment.