Blood Bank Management System Capstone Project Document
Introduction
Blood Bank automation or computerization of the blood bank is the application of computers to perform either in part or as a whole the activities that are carried out in the blood bank setting. Blood bank automation requires the use of computers and associated programs that are suited for the purpose. These associated or group of programs that are use on the computer system can be describe as Pharmacy Management System. Blood Bank management system is used to perform tasks such as registration of customers, blood and staffs. It helps the customer to purchase the required blood bases on their needs. Customer can make transaction through cash. Information related to blood, employees, customers, etc can be easily retrieved. This software is required to eliminate tedious manual searching, cataloguing, and loaning out of medicines, Including registration and clearance of customers. This system is mainly based on collection, storage and usage of blood in needy situations. City life is turning hectic as we move in 21st century. Day by day all the newspapers that were filled with motivating articles and some important news is now filled with either Bollywood stuffs or some kinds of crime, bomb blasts becoming one of the main events. Hence the need of blood is the crucial subject of consideration. Also many diseases are seen to be creped in our day to day life. One of which can be instanced as Thallesmania. One that is affected by this disease also needs the transmission of the blood week by week. Hence blood bank is the most suitable option then.
Problem Statement
The main aim of the project is to effectively manage the blood banking system. This project enables the users to access nearest blood bank with GPS, it also checks the availability of the required blood group, provides necessary information about the volunteer blood donors who have registered by installing the application.
Objective
The main objective of this application is to automate the complete operations of the blood bank. They need maintain hundreds of thousands of records. Also searching should be very faster so they can find required details instantly.
Scope
This application is built such a way that it should suits for all type of blood banks in future. So every effort is taken to implement this project in this blood bank, on successful implementation in this blood bank, we can target other blood banks in the city.
System Analysis
This project has been developed to automate data handling in Blood Bank Management. The different forms have been used to input data, make changes to the existing data, delete some records according to the requirements. The different reports give the user a Firth and knowledge about various details.
This project opens with a splash screen clicking on which takes the user to the screen having login form by clicking on it, the respective password entry form opens. On entering the correct password the main MDI form is invoked, where the user can select the desired form or report from the menu.
- The Cancel button associated with every form cancels the currently performed operation and not the form.
- To exit from the form click the “x” button available on the top corner of every Form.
- It has not been possible to cater to all the possible quires and the project can be upgraded according to the requirements.
There are some important modules in the purpose system, which are:
- Login for admin: This module will allow the administrator to enter their respective forms.
- Donor details: This module will enable admin to add new donor and to change their details.
- Hospital details: This module will enable the Administrator to add new Hospital details, modify their details. The Hospital ID is generated automatically. He can also generate Hospital transaction and allows printing.
- Employee details: This is maintained by the administrator. He can modify the details of the employee, salary of the employees.
- Outsider details: This module enables the administrator to add new outsider details, modify their details. The Outsider ID is generated automatically. He can also generate Outsider transaction and allows printing.
EXISTING SYSTEM
In the manual system, firstly the Blood bank and its staff have to manage information regarding the donor details of all the donors manually. Doing this manual transaction was really tedious job. Secondly information regarding Hospital transactions, employee details was to be maintained. This process is time consuming and it requires a great manual effort.
Disadvantages:
- More time is consumed.
- More hard work to maintain all records.
- Bulk of paper is to be searched for a single search.
Proposed System
Today one cannot afford to rely on the fallible human beings to stand against the Merciless competition where it is not wise to say “to err is human” no longer valid.It is outdated to rationalize your mistake. So, to keep pace with time, to bring aboutThe best result without malfunctioning and greater efficiency we have to replace the unending heaps of files with a much sophisticated hard disk of the computer. One has to use the data management software. Software has been an ascent in automation of various organizations. Many software products working are now in markets, which have helped in making the organizations work easier and efficient. Data management initially had to maintain a lot of ledgers and a lot of paperwork has to be done but now software production, this organization has made their work faster and easier. Now only this software has to be loaded on the computer and work can be done. This prevents a time and money. The work becomes fully automated and any information regarding the organization can be obtained by clicking the button. Moreover, now it’s age of computers and automating such an organization gives the better look.
The advantages of the proposed system as follows:
- To reduce the workload.
- To reduce the processing time.
- To view the details of student and staff and to maintain reliable and update information.
- Easy accessibility to computerized online report.
Tools Information
- Hardware Requirement
Processor : Intel Core Duo 2.0 GHz or more
RAM : 1 GB or More
Hard disk : 80GB or more
Monitor : 15” CRT or LCD monitor
Keyboard : Normal or Multimedia
Mouse : Compatible mouse
- Software Requirement
Operating System : Windows XP, Windows 7
Front End : VISUAL BASIC 6.0
Back End : Microsoft Access 2007
Uml Diagrams
The Unified Modeling Language (UML) was created to forge a common, semantically and syntactically rich visual modeling language for the architecture, design, and implementation of complex software systems both structurally and behaviorally. UML has applications beyond software development, such as process flow in manufacturing.
It is analogous to the blueprints used in other fields, and consists of different types of diagrams. In the aggregate, UML diagrams describe the boundary, structure, and the behavior of the system and the objects within it.
UML is not a programming language but there are tools that can be used to generate code in various languages using UML diagrams. UML has a direct relation with object-oriented analysis and design.
Use Case Diagram
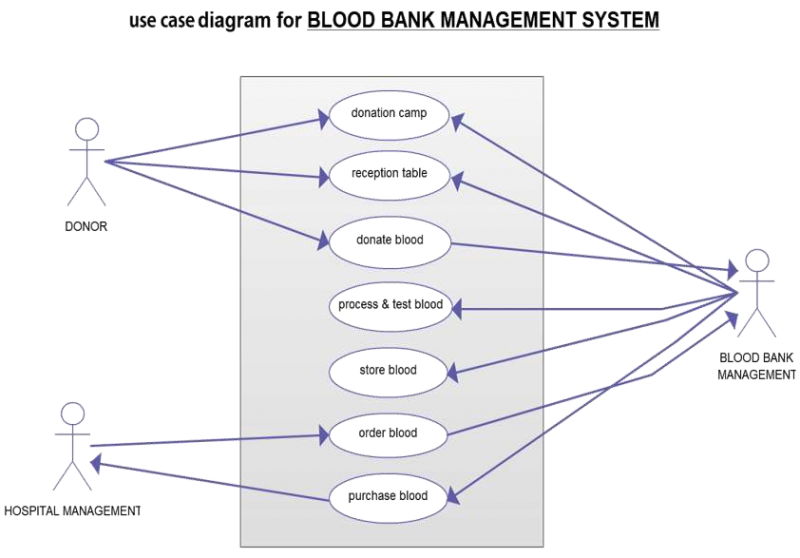
A use case diagram at its simplest is a representation of a user’s interaction with the system. A use case is a list of steps that define interaction between an actor (a human who interacts with the system or an external system) and the system itself. Use case diagrams depict the specifications of a use case and model the functional units of a system. These diagrams help development teams understand the requirements of their system, including the role of human interaction therein and the differences between various use cases. A use case diagram might display all use cases of the system, or just one group of use cases with similar functionality.
- To begin a use case diagram, add an oval shape to the center of the drawing.
- Type the name of the use case inside the oval.
- Represent actors with a stick figure near the diagram, then use lines to model relationships between actors and use cases.
Cases included in following use-case diagram:
- Donation camp,
- Reception table,
- Donate blood,
- Process & test blood,
- Store blood,
- Order blood,
- purchase blood.
Class Diagram
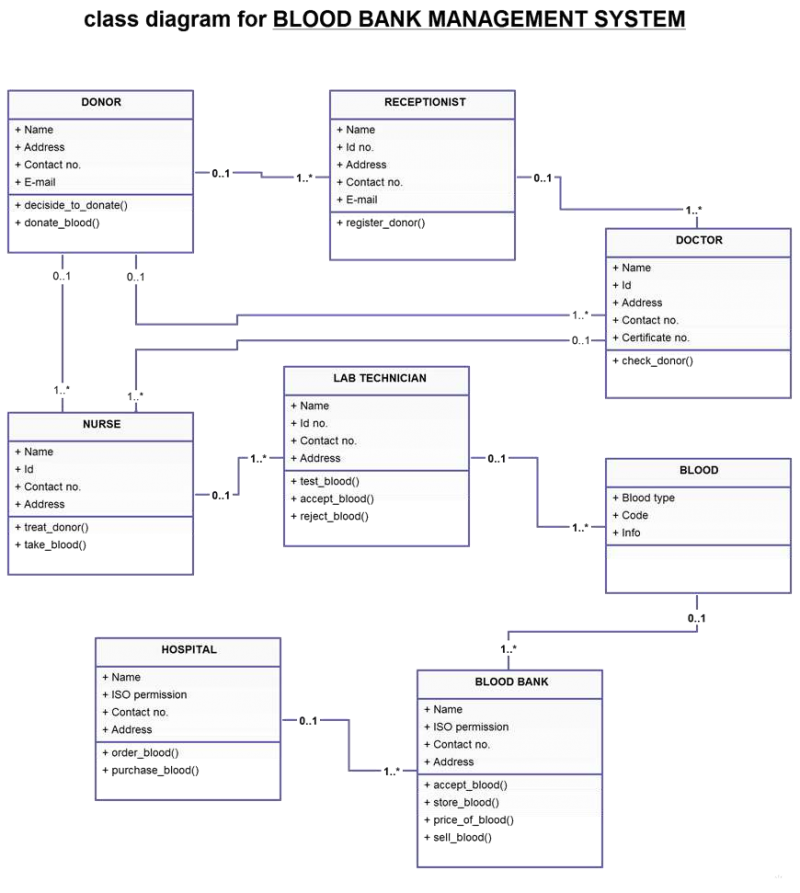
A class diagram in the UML is a type of static structure diagram that describes the structure of a system by showing the system’s classes, their attributes, operations (or methods), and the relationships among objects. Class diagrams represent the static structures of a system, including its classes, attributes, operations, and objects. A class diagram can display computational data or organizational data in the form of implementation classes and logical classes, respectively. There may be overlap between these two groups.
- Classes are represented with a rectangular shape that is split into thirds. The top section displays the class name, while the middle section contains the class’ attributes. The bottom section features the class operations (also known as methods).
- Add class shapes to your class diagram to model the relationship between those objects. You may need to add subclasses, as well.
- Use lines to represent association, inheritance, multiplicity, and other relationships between classes and subclasses. Your preferred notation style will inform the notation of these lines.
Classes included in following diagram:
- Donor,
- Receptionist,
- Doctor,
- Nurse,
- Lab technician,
- Blood,
- Blood bank,
State Diagram
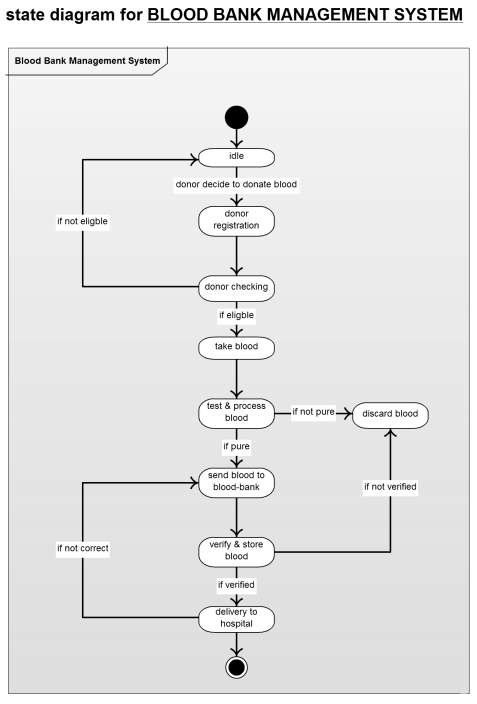
A state diagram is a type of diagram used in computer science and related fields to describe the behavior of systems. State diagrams require that the system described is composed of a finite number of states. A state diagram is used to represent the condition of the system or part of the system at finite instances of time. It’s a behavioral diagram and it represents the behavior using finite state transitions. State diagrams are also referred to as State machines and State-chart Diagrams. These terms are often used interchangeably. So simply, a state diagram is used to model the dynamic behavior of a class in response to time and changing external stimuli. We can say that each and every class has a state but we don’t model every class using State diagrams. We prefer to model the states with three or more states.
Uses of statechart diagram –
- We use it to state the events responsible for change in state (we do not show what processes cause those events).
- We use it to model the dynamic behavior of the system .
- To understand the reaction of objects/classes to internal or external stimuli.
States included in following system:
- Idle,
- Donor registration,
- Donor checking,
- Take blood,
- Test and process blood,
- Send blood to blood bank,
- Verify and store blood,
- Delivery to hospital.
Activity Diagram
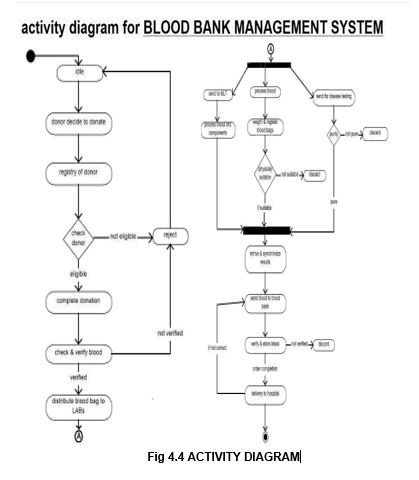
Activity diagrams are graphical representations of workflows of stepwise activities and actions with support for choice, iteration and concurrency. Activity diagrams show the procedural flow of control between class objects, along with recommended you read organizational processes like business workflows. These diagram are made of specialized shapes, then connected with arrows. The notation set for activity diagrams is similar to those for state diagrams.
- Begin your activity diagram with a solid circle.
- Connect the circle to the first activity, which is modeled with a round-edged rectangle.
- Now, connect each activity to other activities with lines that demonstrate the stepwise flow of the entire process.
- You can also try using swimlanes to represent the objects that perform each activity.
The process of activity diagram is same as state diagram, there are mainly two differences;
first: in this diagram condition is checked using rectangle,
second: synchronized bar which use to split and merge activities/state of diagram.
Sequence Diagram
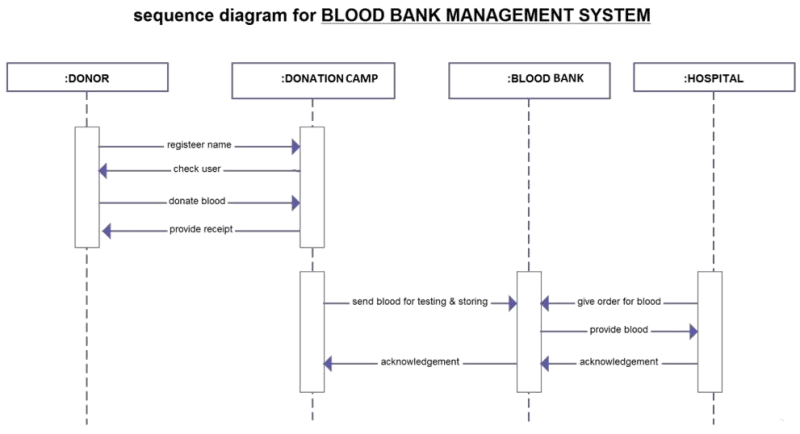
A sequence diagram is an interaction diagram that shows how processes operate with one another and in what order. It is a construct of a Message Sequence Chart. Sequence diagrams, also known as event diagrams or event scenarios, illustrate how processes interact with each other by showing calls between different objects in a sequence. These diagrams have two dimensions: vertical and horizontal. The vertical lines show the sequence of messages and calls in chronological order, and the horizontal elements show object instances where the messages are relayed.
- To create a sequence diagram, write the class instance name and class name in a rectangular box.
- Draw lines between class instances to represent the sender and receiver of messages.
- Use solid arrowheads to symbolize synchronous messages, open arrowheads for asynchronous messages, and dashed lines for reply messages.
A sequence diagram shows, as parallel vertical lines (lifelines), different processes or objects that live simultaneously, and, as horizontal arrows, the messages exchanged between them, in the order in which they occur.This allows the specification of simple runtime scenarios in a graphical manner.
CONCLUSION
In this project, “BLOOD BANK MANAGEMENT SYSTEM” we have tried to computerize various processes of Blood Bank. Blood Bank Management System is very flexible software and can be used in any branch of BLOOD BANK for keeping record. In this software we have tried to provide all the Blood bank management system related record keeping facilities which helps to keep record and employees who belongs to it. The main focus of this project is to less in human efforts. The maintenance of the record is made efficient, as all the records are stored in the SQL database. It is user interactive and effective than the existing system. The flexibility of visual basic helps to maintain the “BLOOD BANK MANAGEMENT SYSTEM” more efficiently.



Leave A Comment
You must be logged in to post a comment.