E-Service System of Marketplace
Introduction
It is globally known that, in today’s market, many restaurants are emerging from a small scale of businesses to well-established and settled ones. Competition is extremely tough since all restaurants are striving to serve their best for their customers. In today’s fast paced of time, everyone is always in a hurry, that even the leisure of time used for spending pleasures like enjoying a meal is being controlled just to fit the busyness of people. The customers nowadays are not only attracted to online menu because of its convenience in searching, but also an easy way to see the items offered by the restaurants.

E-Service System, greatly simplifies the searching process of customers and the advertising of tenants. The proposed system presents an interactive and up-to-date menu with the available services offered by the tenants in the Marketplace. Customers can see all registered tenants of the Marketplace which displays their menus, prices, services and other information that includes contact number, email, address. Through this, customers can easily browse what the tenants are offering and their reviews will easily be displayed. Reviews posted by customers is entered into the database and will be visible both to the tenants and the customers. This allows the customers to review their experience based on the services given by the tenants, and it also allows tenants to know what part of their services would they need to improve.
Background of the Study
As Matt McGee pointed out, “80 percent of consumers want to see a menu before they eat at a restaurant, and 70 percent wanted to be read the menu in a mobile device.” No website, no menu, no business. This study looks at the current problem of the tenants in the Marketplace:
The company’s popularity, familiarity and sales had decreased due to rising stores covered by online marketing techniques. Only the stores that are known are visited and the competition is always tough and hard.
Hence to solve this issue, what the proponents propose is “E-Service System”, a web based system, originally designed for the admin and tenants of the Marketplace in Villa Angela.
The main advantage of this system is that it greatly simplifies the browsing of customers for the menus of the tenants, and the advertising of tenants.
Statement of the Objective:
Design an automated system for Villa Angela, Marketplace with the criteria such as the effectiveness of the system, efficiency of the system, quality of the system, timeliness of the system and the productivity of the system
The following are the specific objectives:
- Implement the E-Service System for Marketplace.
- Develop an online portal for every tenants registered in the
- Secure the data of tenant’s list of menus and prices.
- Generate reports such as:
-
- Customer evaluation & recommendations for every tenants.
- Current registered tenants.
- Backup and archiving system of every tenant’s record.
Conceptual Framework
The conceptual framework of this system shows and indicates the flow of the system and helps the users and all the readers understand how it will be processed or functioned. This study is intended to improve the existence of a manual way of showcasing the information of the registered tenants of The Marketplace in order to have the tenants of Marketplace be identified and recognized by the public.
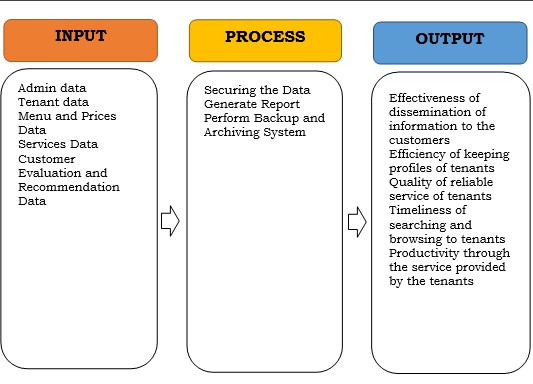
Figure 1: Conceptual Framework of the System
Scope and Delimitation of the Study
This section enumerates the scope covered by the study and its delimitation.
Scope
The study covers E-Service System of Marketplace, it is a web-based system that focuses on all tenants of the Marketplace in Villa Angela. The Marketplace will register all their tenants in the website, this enables tenants to have their very own page wherein they are able to post their menu, its prices and available services. It will also display reviews and ratings made by customers who had already experienced the services of the tenants. Through this system, it will help the Marketplace advertise their tenant’s services and it will also help customers find their choice. Through this, the tenants can also identify what area of their service needs to be improved.
Delimitation
- This study is limited to the office of the Marketplace and the three end users: the admin, and the tenants who are only authorized to maintain and update the records in the system and the customers who will use the system for viewing.
- Only registered tenants under Marketplace can be displayed in our system features.
- Can only generate reports such as (customer evaluation & recommendations for every tenants, current registered tenants.)
- Accessible through online.
- It does not accommodate booking and reservation to the tenants.
Significance of the Study
The study is intended to various set of people who could benefit in the system. The result of this study will be beneficial to the following:
Manager/Owner of Marketplace. This system is a tool in serving and helping both the customer and its owner. Its main function focuses more on the management side, in building strong and competitive advantage in a competitive world of food and services of business. Also, it provide accurate information to the public in terms of dishes, drinks and even sets of stalls.
Tenants. This system will enable the tenants of the Marketplace have their very own page in the website so they could add an update of their information.
Customer. This system aims to provide a quality and updated information in feeding the public in terms of events and new sets of courses offered by every stall in the Marketplace. Public are also being heard through its feedback, comments and suggestion in every stalls that they visited. Also public place an important role in making the business prosper that why they are highly equip with information and served well. In this system “much priorities are given to them because they are the fuel that keeps the fire burning”-the owner.
Proponents. This system will enable them to apply what they have studied and researched.
Future Researchers. This system may provide basis to the future researchers who may experience a related system. In addition, can give them information that is updated and highly commendable.
Definition of Terms:
Admin. Conceptually, it is an administrator of a computer system, an online forum, etc (*Urban Dictionary: admin, “ n.d.)
Operationally, they are responsible for the data gathered by the system.
Data. Conceptually, factual information (such as measurements or statistics) used as a basis for reasoning, discussion, or calculation . (*Data|Definition of Data by Merriam-Webster, n.d.)
Operationally, these are important and necessary information in order to run a system and finish a project.
E-service. Conceptually, The provision of services via the Internet. (*E-service|Definition of Wikipedia.com, n.d.)
Operationally, a type of service that is currently trending and to be implemented on the Villa Angela Marketplace website.
Functions. Conceptually, it is defined as an activity or purpose natural to or intended for a person or thing. (*Function | Define Function at Dictionary.com,n.d.)
Operationally, it is a type of an activity or purpose that is useful and beneficial to a business.
Marketplace. It is a place in Villa Angela where tenants rent for a space in order to manage their tenants.
Menus. It is a list of food and beverage available served by tenants in Villa Angela Marketplace and will be also important for the website of the Villa Angela Marketplace .
Owner/Manager. Someone who is in charge of a business. Person in authority in the office of The Marketplace. (*Manager|Definition of Manager by Merriam-Webster, n.d.)
Tenants. These are the one owners of restaurants who temporarily rents a lot in the Villa Angela Marketplace.
Customers. These are the people who uses the system of the Marketplace who visits the site for viewing or giving recommendations to the tenants.
Website. Is a marketing tool used by many restaurants to bring more customers to their doors.
Review Of Related Literature
This chapter discusses the existing study into the context of proceeding related research. These research study cited articles and systems, which are pragmatic are based on research and design of the developer to meet the customer’s need.
Local Studies
Looloo
Looloo is a review and place discovery social networking application for iOS and mobile site based in the Philippines. It is a proudly Philippine-made app for Filipinos, inspired by Urbanspoon in the US. Launched in November 21, 2012, its primary function is to allow users to explore and discover restaurants, bars, hotels, salons, spas, and other places of interest through crowd-sourced reviews layered with the social dimension of being able to follow, recommend, and credit other users. The people in Looloo are down-to-earth and fanatic about discovering new restos and sharing it on the platform.(“Looloo.com” n.d.)
Munchpunch
Munchpunch is an online food menu guide for Metro Manila. They display all restaurant’s menus and its prices. It’s function is to help users look for a place- restaurants, bars and cafe in certain areas. It provides information, list of menus, and reviews of the restaurants. They cater over 1.2 million customers every month and help them satisfy craving – like helping find where to have steak, adobo, milk tea or even flourless chocolate cake. Their team is dedicated to make restaurant and food search a breeze. (“Munchpunch.com” n.d.)
Foreign Studies
Bahama Breeze
HackTheMenu is the primary resource for all Menu items for your favorite fast food restaurant chains. Customers often wonder what the cost of their favorite menu item is before driving over to the restaurant. By leveraging the knowledge of our community, we are dedicated to providing customers with details about the most up to date restaurant menu prices that we can find! Of course, not all restaurants will have the same prices, but this can be a general guide to the most common prices found around the country. HackTheMenu is a one-stop resource for all Secret Menu items at all fast food restaurants. (“bahamabreeze.com” n.d.)
Fast-food Menu Prices
There are many fast food fans all over the world that like a variety of foods. Some like the greasier stuff, others prefer the healthier options. Whoever you are, this website is for you. At FastFoodMenuPrices.com, we have the largest collection of fast food restaurant that you can find anywhere. It includes the restaurant menu prices, A picture and the description of food and the comments given by customers. Our hope is to help consumers navigate the vast industry of fast food and decide what is the best food for their money in order for them to be informed about the menu that the restaurant is having. (“FastFoodMenuPrices.com” n.d.)
Related Systems
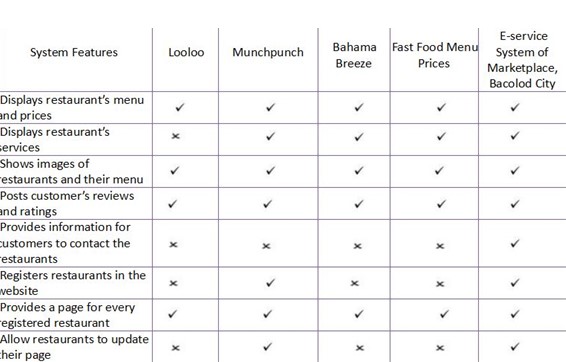
Table 1: Related Systems
Table 1 shows features of the proposed system in the first column, whereas the following columns are the features of the related systems.
Synthesis
The system that was presented were obtained from both foreign and local system study that were made basis for the developed information system. It has also described the features that are available on the system that are not available with reflect to each other.
All the related systems presented, shares similar nature to the study but were observed to have a lack of security in keeping the records for the reports to be produced when in need, it was observed that all restaurants listed are not managed by the restaurants themselves, hence, the update for the menu would not be easily changed and it would take longer time before the update would be realized by the admin. Also, one of the things observed was the lack of contact for the different restaurants displayed. Hence, customer doesn’t have direct communication with the restaurants if they have any inquiry about the service.
The system discussed are correlated to the proponents’ system, the E-Service System of Marketplace. The researchers analyzed accurately and evaluated the related system based on its modules and its functions.
The related system has made the proponents realized some functions and factors that would help the proposed system to be more advanced, accurate and effective for the users. Furthermore, the proponents acquire some features in the related studies and merged it to the system to be more beneficial to the company.
Methodology
This chapter discusses the research strategy and procedures on how the system flows and it’s phases.
The proponents followed the standard of Rapid Application Development (RAD) to define the present solution for the problems identified in this study through the use of it.
In this model, the stages have some connection, meaning that there are many tasks that happen concurrently by utilizing a rapid application development method. Designers and developers can aggressively utilize knowledge and discoveries gleaned during the development process itself to shape the design and or alter the software direction entirely.
The Rapid Application Development Model is broken down into different phase. Basic phases of Rapid Application Development are as follows: Requirement Planning, Prototyping (user design and construction), Testing and Cut-over.
Requirement Planning
During this initial stage, the group members came to a rough agreement on project scope and system requirement. Workloads are distributed in a fair and just manner. Questions and problems are being discussed one by one and answered appropriately. Objectives and studies were used as basis for the developing system.
Prototyping
In this phase prototyping includes two (2) sub-components such as user design and construction. User Design: User feedback is being gathered with heavy emphasis on determining the system architecture. This allow initial modeling and prototypes be created. This step is repeated as often as necessary as the project evolves. Construction: Once basic user and system design has begun, the construction phase is where most of the actual systems coding, testing, and integration takes place. Along with User Design, the Rapid Construction phase is repeated as often as necessary, as new components are required or alterations are made to meet the needs of the project.
Testing
In this phase, the proponents will test the input and output of the system to determine if this system gives the correct operation that is provided. We invited guests and the owner of the company to test and to verify if we have met their system requirement.
Cutover
Resembles the final tasks in the SDLC implementation phase, including data conversion, testing, changeover to the new system and user training. Compared with traditional methods, the entire process is compressed. As a result, the new system is built, delivered and placed in operation much sooner.
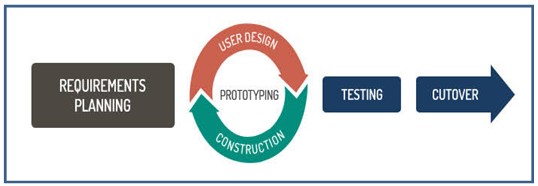
Figure 2: Rapid Application Development
Technical Feasibility
Hardware Requirement (recommended)
Hard Disk: minimum of 120 GB
Memory: minimum of 2 GB
Processor: at least Core to Duo
Monitor: 14”
Web server
Mouse
Keyboard
Software Requirement
Domain name
Operating System: Windows 7 or higher
Browser: Firefox, Google Chrome, Opera
Laravel: 3.1.9 version
Program Environment
Front End
Bootstrap
Bootstrap is an open source toolkit for developing with HTML, CSS and JS. Quickly prototype your ideas or build your entire app with Sass variables and mixins, responsive grade system, extensive prebuilt components, and powerful plugins built on Jquery.
Back End
PHP
PHP is a server-side scripting language designed for web development but also used as a general-purpose programming language. Originally created by Rasmus Lerdorf in 1994, the PHP reference implementation is now produced by The PHP Group.
Architectural Diagram
Figure 3 displays the structural design of the system wherein the admin has all the access in the system like add, edit, delete and generate reports. However, the tenants are in-charge in adding and updating their record in their page which is to be approved first by the admin to generate reports.
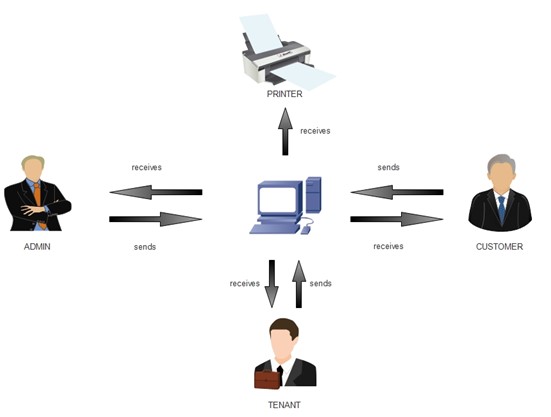
Figure 3: Architectural Diagram of E-Service System of Marketplace
Feasibility Schedule
The feasibility schedule contains the record of the amount of time
the proponents spent on the system.
Gantt Chart
The following tables show the Gantt chart of the tasks that have been done by the proponents with the time allotted for the establishment of the entire system.
| WORK BREAK DOWN | ||||||
| REQUIREMENT PLANNING | PERCENTAGE COMPLETED | 87% | TOTAL | 11 Days | ||
| RESOURCES | TASK | START | END | Percentage Completed | Duration (Days) | Completion Percentage |
| all group member | Group Discussion | Feb. 02, 2018 | Feb. 02, 2018 | 75% | 1 | 75% |
| N.B. Chavez | Assigning Members role | Feb. 03, 2018 | Feb. 03, 2018 | 75% | 75% | |
| N.B. Chavez | Segregation of work loads per chapter | Feb. 04, 2018 | Feb. 04, 2018 | 87% | 1 | 87% |
| Draw lots for group adviser | Feb. 05, 2018 | Feb. 05, 2018 | 95% | 1 | 95% | |
| N.B. Chavez | Preparation of sample forms | Feb. 06, 2018 | Feb. 06, 2018 | 88% | 1 | 88% |
| all group members | Data gathering/ conduct interview | Feb. 07, 2018 | Feb. 08, 2018 | 82% | 2 | 82% |
| N.B Chavez, Y. Debuyan, J. Maraggun | Generate Problems | Feb. 09, 2018 | Feb. 09, 2018 | 86% | 1 | 86% |
| J. Maraggun | Create Objectives | Feb. 10, 2018 | Feb. 10, 2018 | 89% | 1 | 89% |
| N.B. Chavez | Research on Local Studies | Feb. 11, 2018 | Feb. 11, 2018 | 93% | 1 | 93% |
| N.B. Chavez | Research on Foreign Studies | Feb. 12, 2018 | Feb. 12, 2018 | 93% | 1 | 93% |
| N.B. Chavez | Create Related System | Feb. 13, 2018 | Feb. 13, 2018 | 85% | 1 | 85% |
Table 2.0 Requirement Planning
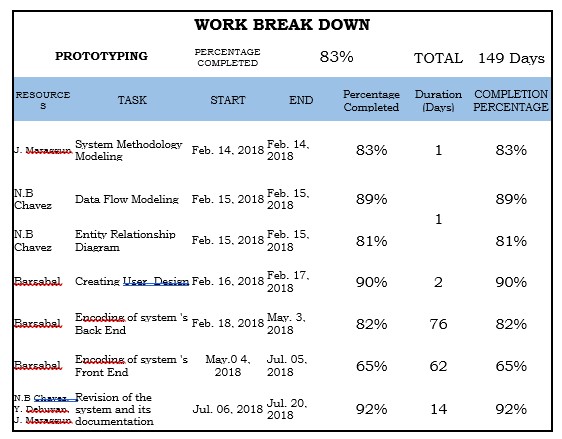
Table 3.0 Prototyping
| WORK BREAK DOWN | ||||||
| TESTING | PERCENTAGE COMPLETED | 91% | TOTAL | 17 Days | ||
| RESOURCES | TASK | START | END | Percentage Completed | Duration (Days) | COMPLETION PERCENTAGE |
| Barsabal, N.B Chavez | Testing for bugs and errors (internally) | Jul. 21, 2018 | Jul. 21, 2018 | 89% | 1 | 89% |
| Barsabal | Verifying and Testing of Adviser (Mr. Castillo) | Jul. 22, 2018 | Jul. 22, 2018 | 92% | 1 | 92% |
| Barsabal | Pilot Testing of system | Jul. 23, 2018 | Aug. 01, 2018 | 88% | 10 | 88% |
| Barsabal | Hosted company Testing | Aug. 02, 2018 | Aug. 06, 2018 | 95% | 5 | 95% |
Table 4.0 Testing
| WORK BREAK DOWN | ||||||
| CUTOVER | PERCENTAGE COMPLETED | 93% | TOTAL | 10 Days | ||
| RESOURCES | TASK | START | END | Percentage Completed | Duration (Days) | COMPLETION PERCENTAGE |
| Barsabal | Installation of hardware/ software components | Aug. 07, 2018 | Aug. 09, 2018 | 87% | 3 | 87% |
| Barsabal | Testing | Aug. 10, 2018 | Aug. 11, 2018 | 93% | 2 | 93% |
| all group members | Actual presentation and Training | Aug. 12, 2018 | Aug. 15, 2018 | 95% | 4 | 95% |
| all group members | Turn over | Aug. 16, 2018 | Aug. 16, 2018 | 95% | 1 | 95% |
Table 2.3 Cut-over
| SOFTWARE DEVELOPMENT SUMMARY | |||
| PHASE | DURATION (DAYS) | TOTAL AVERAGE COMPLETION | |
| Requirement Planning | 11 | 87% | |
| Prototyping | 149 | 88% | |
| Testing | 17 | 91% | |
| Cutover | 10 | 93% | |
| RESULT | 5.2 | 6.02 | 4.87 |
| INTERPRETATION | MONTHS | DAYS | HOURS |
| 6 | 14 | 5 | |
Table 2.5: Software Development Summary Phase
Cost Benefit Analysis
Cost Benefit Analysis or the CBA is a process wherein business decisions are analyzed. The benefits of a business-related action are summed and the costs associated with taking that action are subtracted to determine whether the company can benefit from the system.
Table 3.0 : Developmental Cost
| Development Cost | Duration | Cost | Total Amount |
| Programmer | 5 months | 9,745.50 | 97,455.00 |
| System Analyst | 5 months | 14,833.33 | 148,333.30 |
| Internet | 5 months | 650.00 | 6,500.00 |
| Computer Set (1) | 25,000.00 | 25,000.00 | |
| Total | 277,288.30 |
This table shows the Developmental Cost of the researched system. The Developmental Cost includes the payment for the programmer and system analyst and other cost in the researched system.
Table 3.1: Operational Cost
| Operational Cost | Duration | Cost | Total Amount |
| Maintenance Fee | 12 months | 1,500.00 | 18,000.00 |
| Electricity | 12 months | 2,000.00 | 24,000.00 |
| Printer | 4,750.00 | 4,750.00 | |
| Bond Paper | 500.00 | 500.00 | |
| Ink | 1,150.00 | 1,150.00 | |
| Total | 48,400.00 |
This table shows the Operational Cost of the researched system. The Operational Cost includes the maintenance cost and other expenses in using the researched system.
Table 3.2: Total Cost
| Total Amount | |
| Total Developmental Cost | 277,288.30 |
| Total Operational Cost | 48,400.00 |
| Total | 325,688.30 |
This table shows the total amount of Developmental Cost and Operational Cost of the researched system.
Table 3.3: Benefits of the System
| Benefits of the System | No. of Months | Cost | Total Amount |
| Efficiency of Work Output | 12 | 5,000.00 | 60,000.00 |
| Confidentiality of Data | 12 | 1,200.00 | 14,400.00 |
| Security of Data | 12 | 1,500.00 | 18,000.00 |
| Data Backup | 12 | 1,000.00 | 12,000.00 |
| Advertisement | 12 | 3,500.00 | 42,000.00 |
| Total | 146,400.00 |
This table shows the benefits of the researched system. The proponents have analyzed the presumed amounts or value of each item that would benefit the company.
Table 3.4: Cost Benefit Analysis (Proposed)
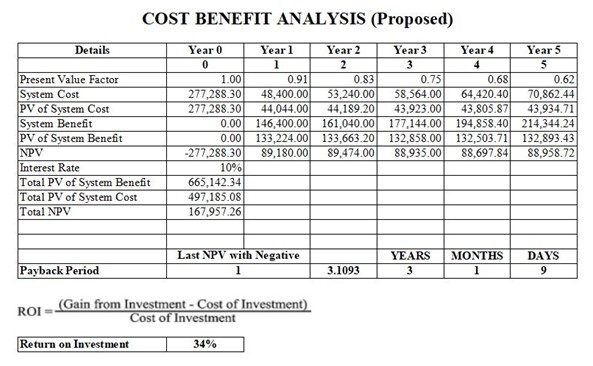
Table 2.4, shows a chart of the Cost and Benefits Analysis. The Return of Investment comes out of 34%. The Payback Period was computed by taking the sum of the Present Value of System Benefit (Php 133,224.00) subtracting it to the Present Value of System Cost (Php 227,288.30) to get its Net Present Value and get the sum of Net Present Value (Php 89,180.00) subtracting it to the negative value of System Cost (Php -497,185.08), and dividing the difference Net Present Value (Php 89,180.00). Resulting to 1.64 which is round to 2, making it a 2-year payback period. Payback period = Initial Investment/Cash Inflow. The ROI was computed by taking the sum of the Total Present Value of System Benefits (Php 665.142.34), subtracting it to the Total Present Value of System Cost (Php 497,185.08), and dividing the difference Total Present Value of System Cost (Php 497,185.08). The quotient is 664830.7924 which is equivalent to 34% of ROI or Return of Investment. The formula that the proponents used can be seen on Table 3.4.
Use Case Diagram
Figure 4 shows the activity of the admin and the authorized personnel in the system. The admin can access all the transactions that the system provides. Registered users have the privilege to view the system.
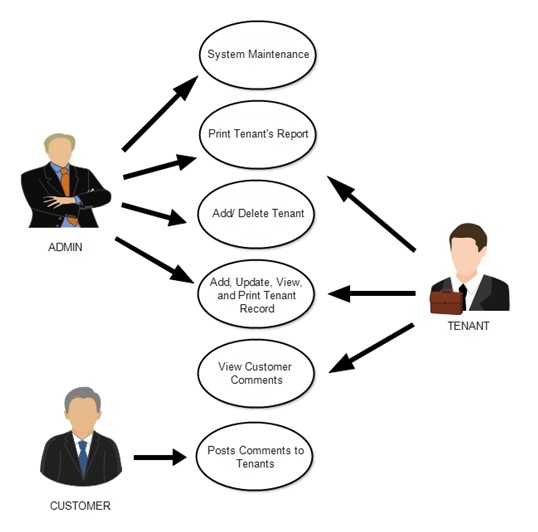
Figure 4: Use Case Diagram of E-Service System of Marketplace
Data Flow Diagram (Gane-Sarson)
The flow of the system begins when the admin process statistical reports; input the statistical records. Next is to process residence information. By the time that the reports are encoded, it will automatically be saved into the database and can be printed. Then, the admin generates reports at the end of any transaction that will be used in making yearly statistical reports.
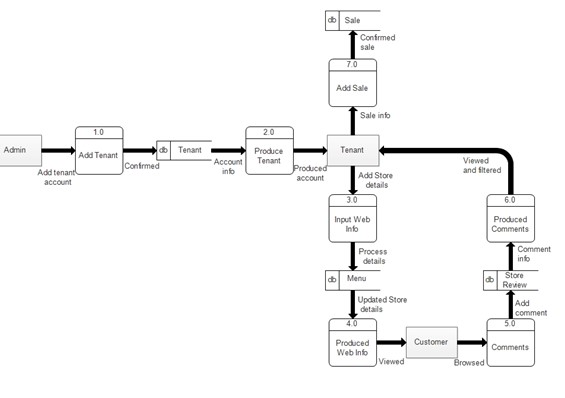
Figure 5: Data Flow Diagram of E-Service System of Marketplace
Database Dictionary
Table 4.0: Admin table
| Admin | ||||
| Field Name | Data Type | Field Length | Constrain | Definition |
| Id | int | 10 | Primary Key | Unique identifier of admin |
| Store_id | int | 10 | Foreign Key | Unique identifier of store |
| Name | varchar | 225 | not null | Admin name |
| varchar | 225 | not null | Admin email | |
| Password | varchar | 225 | not null | Admin password |
| Remember_token | varchar | 100 | not null | For remember admin |
| Created_at | timestamp | null | Date of when it was created | |
| Updated_at | timestamp | null | Date of when it was updated | |
| Deleted_at | timestamp | null | Date of when it was deleted | |
Table 4.1: Admin role table
| Admin_role | ||||
| Field Name | Data Type | Field Length | Constrain | Definition |
| Admin_id | int | 10 | Foreign Key | Unique identifier of admin |
| Role_id | int | 10 | Foreign Key | Unique identifier of role |
| Created_at | timestamp | null | Date of when it was created | |
| Updated_at | timestamp | null | Date of when it was updated | |
| Deleted_at | timestamp | null | Date of when it was deleted | |
Table 4.2: Roles Table
| Roles | ||||
| Field Name | Data Type | Field Length | Constrain | Definition |
| Id | int | 10 | Primary Key | Unique identifier of role |
| Name | varchar | 225 | not null | Role name |
| Display_name | varchar | 225 | not null | Displayed name for role |
| Description | text | not null | Role description | |
| Created_at | timestamp | null | Date of when it was created | |
| Updated_at | timestamp | null | Date of when it was updated | |
| Deleted_at | timestamp | null | Date of when it was deleted | |
Table 4.3: Permissions Table
| Permissions | ||||
| Field Name | Data Type | Field Length | Constrain | Definition |
| Id | int | 10 | Primary Key | Unique identifier of Permission |
| Name | varchar | 225 | not null | Permission name |
| Display_name | varchar | 225 | not null | Display name for permission |
| Description | text | not null | Description for permission | |
| Created_at | timestamp | null | Date of when it was created | |
| Updated_at | timestamp | null | Date of when it was updated | |
| Deleted_at | timestamp | null | Date of when it was deleted | |
Table 4.4: Permission Role Table
| Permission_Role | ||||
| Field Name | Data Type | Field Length | Constrain | Definition |
| Permission_id | int | 10 | Foreign Key | Unique identifier of permission |
| Role_id | int | 10 | Foreign Key | Unique identifier of role |
| Created_at | timestamp | null | Date of when it was created | |
| Updated_at | timestamp | null | Date of when it was updated | |
| Deleted_at | timestamp | null | Date of when it was deleted | |
Table 4.5: Store Table
| Store | ||||
| Field Name | Data Type | Field Length | Constrain | Definition |
| Id | int | 10 | Primary Key | Unique identifier of store |
| Image | varchar | 225 | not null | Store image |
| Name | varchar | 225 | not null | Store name |
| Address | text | not null | Store address | |
| Created_at | timestamp | null | Date of when it was created | |
| Updated_at | timestamp | null | Date of when it was updated | |
| Deleted_at | timestamp | null | Date of when it was deleted | |
Table 4.6: Store Review Table
| Store_Review | ||||
| Field Name | Data Type | Field Length | Constrain | Definition |
| Id | int | 10 | Primary Key | Unique identifier of |
| Store_id | int | 10 | Foreign Key | Unique identifier of store |
| Name | varchar | 225 | not null | Customer name |
| varchar | 225 | not null | Customer email | |
| Body | text | not null | Customer reviews | |
| Rating | smallint | 6 | not null | Customer ratings |
| Created_at | timestamp | null | Date of when it was created | |
| Updated_at | timestamp | null | Date of when it was updated | |
| Deleted_at | timestamp | null | Date of when it was deleted | |
Table 4.7: Sales Table
| Sales | ||||
| Field Name | Data Type | Field Length | Constrain | Definition |
| Id | int | 10 | Primary Key | Unique identifier of sales |
| Store_id | int | 10 | Foreign Key | Unique identifier of store |
| Amount | decimal | 10,2 | not null | Sale amount |
| Created_at | timestamp | null | Date of when it was created | |
| Updated_at | timestamp | null | Date of when it was updated | |
| Deleted_at | timestamp | null | Date of when it was deleted | |
Table 4.8: Categories Table
| Categories | ||||
| Field Name | Data Type | Field Length | Constrain | Definition |
| Id | int | 10 | Primary Key | Unique identifier of categories |
| Name | varchar | 255 | not null | Category name |
| Description | text | not null | Category description | |
| Created_at | timestamp | null | Date of when it was created | |
| Updated_at | timestamp | null | Date of when it was updated | |
| Deleted_at | timestamp | null | Date of when it was deleted | |
Table 4.9: Products Table
| Products | ||||
| Field Name | Data Type | Field Length | Constrain | Definition |
| Id | int | 10 | Primary Key | Unique identifier of product |
| Image | varchar | 225 | not null | Product image |
| Store_id | int | 10 | Foreign Key | Unique identifier of store |
| Category_id | int | 10 | Foreign Key | Unique identifier of categories |
| Name | varchar | 225 | not null | Product name |
| Description | text | not null | Product description | |
| Price | decimal | 10,2 | not null | Product price |
| Status | smallint | 6 | not null | Product status |
| Created_at | timestamp | null | Date of when it was created | |
| Updated_at | timestamp | null | Date of when it was updated | |
| Deleted_at | timestamp | null | Date of when it was deleted | |
Table 4.9: Product Reviews Table
| Product_Reviews | ||||
| Field Name | Data Type | Field Length | Constrain | Definition |
| Id | int | 10 | Primary Key | Unique identifier of product review |
| Product_id | int | 10 | Foreign Key | Unique identifier of product product |
| Name | varchar | 225 | not null | Customer name |
| varchar | 225 | not null | Customer email | |
| Body | text | not null | Customer reviews | |
| Rating | smallint | 6 | not null | Customer ratings |
| Created_at | timestamp | null | Date of when it was created | |
| Updated_at | timestamp | null | Date of when it was updated | |
| Deleted_at | timestamp | null | Date of when it was deleted | |
Database Model
Entity Relationship Diagram
Entity Relationship Diagram explains every relationship between table’s entity and attributes. Each table has a definition that connects every table, both its primary key and foreign key. Use foreign key if the attributes of the one table have a unique id and foreign key will be identified when the other attributes are in the other table. Each attributes connects in performing every process.
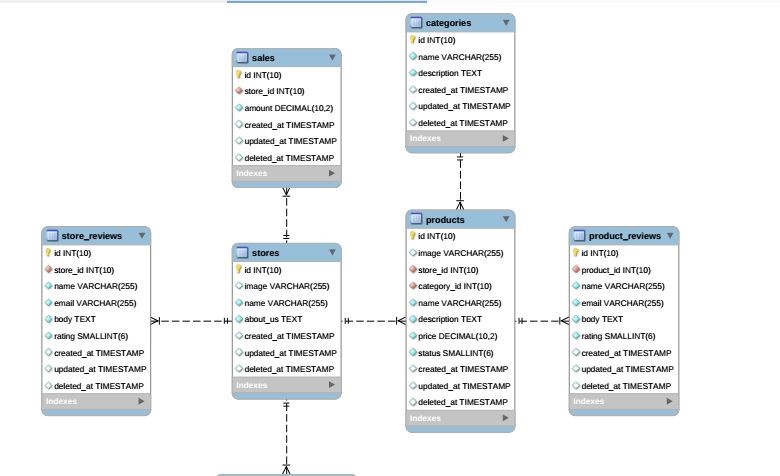
Figure 6: Entity Relationship Diagam
Presentation, Analysis And Interpretation Of Data
This chapter exhibits the results of the User’s Survey conducted for the system to the Marketplace Manager/Owner and Tenants.
Presentation
The proponents demonstrate the system’s functionality to the randomly selected respondents. The proponents observed the respondents on how they response to the system. The respondents were evaluated using the User Acceptance Survey in order for the respondents to distinguish the level of acceptability of the proposed system.
Data Analysis
This section presents the analysis of the data collected and gathered from the respondents of The Marketplace Owner, Manager, Tenants, Employees and Customers.
Characteristics of the Respondents
Table 5.0: Frequency of Respondents
| Respondents | Frequency |
| Marketplace Owner | 1 |
| Marketplace Owner/Staff | 1 |
| Marketplace Tenant | 3 |
| Marketplace Tenant Staff | 4 |
| Marketplace Customer | 41 |
| Total | 50 |
The population composed of the Marketplace admin, staff, tenants and tenant staffs and customers. The proponents got fifty respondents from the administration and the Marketplace staffs.
Table 5.0 shows the number of respondents who have answered the User-Acceptability Survey. The researchers got a total number of 50 respondents.
Reliability Testing
The data collected by the proponents have undertaken reliability testing an acceptable approach through using the Yamanes Formula in order.
Yamanes Formula:
n = Sample size
N = Population size
e = level of precision 0.05 % (5%)
Solution:
This solution explains the summation of getting the sample size (n) of the population that will be taking the user acceptance survey. Where N=30 divided by 1+30 multiplied by 0.0025 as (e) or the level of precision. As the proponents gets the (e), it is divided to 30 as the total population size (N). The result was 28 for the sample size of the population (n).
Interpretation of Data
Table 5.1: Interpretation of data
| Range Of Mean | Verbal Interpretation |
| 4.21-5.00 | Very Satisfied |
| 3.41-4.20 | Satisfied |
| 1.81-2.60 | Dissatisfied |
| 1.00-1.80 | Very Dissatisfied |
The instrument wished to access the perception of the users in terms of five (5) categories namely: Effectiveness, Efficiency, Quality, Timeliness and Productivity. The first category was composed of four (4) items, the second category was composed of three (3) items, and the third, fourth and last categories were composed of four (4) items. Table 5.6 shows that the user’s survey result for the system’s quality came back with a total mean of 3.88 which interpret that the users were very satisfied with the system’s quality after testing it.
Effectiveness
Table 5.2: Survey Result – Effectiveness
| System Quality Performance | Total Mean | Verbal Interpretation |
| Effectiveness | 4.48 | Very Satisfied |
Table 5.2 shows that the user’s survey result for the effectiveness of the system came back with a total mean of 4.5 which interpret that the users were satisfied with the system’s effectiveness after testing it.
The respondents stated that the proposed system (BEIS) meet the desired result and it produced the desired output. They also stated that the system is effective, it means it has an intended or expected outcome.
Efficiency
Table 5.3: Survey Result – Efficiency
| System Quality Performance | Total Mean | Verbal Interpretation |
| Efficiency | 4.52 | Very Satisfied |
Table 5.3 shows that the users survey result for the system’s efficiency came back with a total mean of 4.56 which interpret that the users were very satisfied with the efficiency of the system after testing it.
The respondents stated that the system (BEIS), has the ability to avoid wasting materials, energy, efforts, and time in generating and recording statistical reports. In a more general sense, the system (BEIS), has the ability to do things well, successfully, and without waste.
Quality
Table 5.4: Survey Result – Quality
| System Quality Performance | Total Mean | Verbal Interpretation |
| Quality | 4.55 | Very Satisfied |
Table 5.4 shows that the user’s survey result for the system’s quality came back with a total mean of 4.53 which interpret that the users were very satisfied with the system’s quality after testing it.
The respondents stated that the system (BEIS), meet the standards of the users in terms of its degree of excellence.
Timeliness
Table 5.5: Survey Result – Timeliness
| System Quality Performance | Total Mean | Verbal Interpretation |
| Timeliness | 4.59 | Very Satisfied |
Table 5.5 shows that the user’s survey result for the system’s quality came back with a total mean of 4.56 which interpret that the users were very satisfied with the system’s quality after testing it.
The respondents stated that the system (BEIS), has the quality in generating and recording statistical reports in favorable or useful time.
Productivity
Table 5.6: Survey Result – Productivity
| System Quality Performance | Total Mean | Verbal Interpretation |
| Productivity | 4.67 | Very Satisfied |
Table 5.6 shows that the user’s survey result for the system’s quality came back with a total mean of 4.63 which interpret that the users were very satisfied with the system’s quality after testing it.
The respondents stated that the system (BEIS) has the ability to produce a desired result. They measured the ratio of output to inputs used in a production process, i.e. output per unit of input.
System Satisfaction
Table 5.7: Survey Result – System Satisfaction
| System Quality Performance | Total Mean | Verbal Interpretation |
| System Satisfaction | 4.68 | Very Satisfied |
Table 5.7 shows that the user’s survey result for the system’s satisfaction came back with a total mean of 4.7 which interpret that the users were very satisfied with the system’s quality after testing it.
Over All
| System Quality Performance | Total Mean | Verbal Interpretation |
| Overall | 4.58 | Very Satisfied |
Table 5.8: Survey Result – Over All
Summary Of Findings, Conclusions And Recommendations
This chapter presents the summary of the findings, and the conclusions and the recommendations for the system study.
Summary of Findings
This study was conducted for the purpose of designing an E-Service System for Marketplace, to objectively result to a faster, efficient, and effective e-service to the company. The descriptive method of research was utilized and the survey technique was used for gathering date. A questionnaire served as an instrument for the collection of data.
The proponents conducted a survey to the Marketplace. There were 1 owner, 1 manager, 3 tenants, and 4 tenant staffs and to the customers . The survey was conducted after the system had all the requirements, functionalities and features embedded.
The findings suggested that on the level of the user’s experience in terms of effectiveness of the system a mean score of 4.48 was obtained, interpreted as “very satisfied”. As to the experience of the user in the efficiency category, it obtained a mean of 4.52, it interpreted “very satisfied”. On its system quality category, the users, it raked a mean of 4.55 interpreted as “very satisfied”. On timeliness category, the users gave a mean of 4.58 interpreted as “very satisfied”. On productivity category the user gave a mean of 4.67 interpreted as “very satisfied”. And on the last category which is the system satisfaction the users gave it a mean 4.68 interpreted as “very satisfied”. In overall, the systems rating is collected a mean of 4.58 is interpreted as “very satisfied” rating.
Conclusion
The proponents conclude that the system is fully operational and dynamic, as of the sum data gathered. This condition is on the premise that it has addressed the necessary automation requirement of the firm after the thorough system study.
Recommendations
As the proponents had made an information system for the Marketplace, the manager of the Marketplace was very pleased with the system and has concluded to adapt the system for their company. The system shall have 3 months of free implementation to the company together with it’s security. After, it will have maintenance for every 6 months to maintain and update its functions and also for the security of its databases.
References
Fastfoodmenuprices.com
Munchpunch.com
Looloo.com
Bahamabreeze.com
W3computing.com
XinCHao Vietnamese Resto E-menu: Mobile Application
https://localu.org/blog/introduction-to-local-search-for-restaurants/
https://www.payscale.com/research/PH/Job=Systems_Analyst/Salary
Leave A Comment
You must be logged in to post a comment.