Barangay Market Monitoring System
Introduction
In today’s time, a person is largely exposed to the technology. Our generation is much more skillful in using it, and technology is much useful and helpful to the business world. According to Dr. Philip Kotler, market is defined as, “the science and art of exploring, creating, and delivering value to satisfy the needs of the target market at a profit. Marketing identifies unfulfilled needs and desire. It defines, measure and quantities the size of the identified market and the profit potential”. (Kotler, 2017) Our system entitled Barangay Market Monitoring System, is designed to help monitor the week-to-week activities of vendors, and their respective business.
The market monitoring system is a relatively new concept in information systems management capstone project, as it deals with diversified products to monitor. At the same time, monitoring a systemic activity is also a challenge considering the variety and volume of transactions that happen with in each business entity.
Background of the study
Before Barangay only has an old market way back 2003, Atty. John Orola donated it as the years passed by Congressman Stephen Paduano donated an extension for the Barangay Market. The new market has started last June 2017. As of now, there are three chicken stalls, three fish stalls, eleven vegetables stalls, one rice stall and 3-meat stalls.
Barangay aims to embrace technological advantages in accomplishing tasks to create new solutions for the lives of the people. The desire is to make the lives of Barangay people easier and realiable as much as possible; most especially for the vendors and for the economical growth of Barangay estefania. This will also help for the faster monitoring and controlling of statistical records of products and prices of the Barangay market.
Statement of the Objective:
This project aims to develop an automated market monitoring system for Barangay Market.
This project primarily aims to accomplish the following:
- Develop a secure and complete records management of Barangay Market tenants.
- Create statistical reports of product placement and pricing.
- Develop accessible, efficient, and effective website for market vendors, Barangay officials encharge, and residents of Brgy. to monitor products.
- Effectiveness of the system
- Efficiency of the system
- Quality of the system
- Timeliness of the system
- Productivity of the system
Conceptual Framework
This study intends to collect the data from the vendors of the Barangay Market for the monitoring of the market system.
Barangay monitoring system is a local system that can be accessed by the official of the barangay and encode the vendor’s information.
This system generates statical records such as total of the products and the prices of the barangay market.
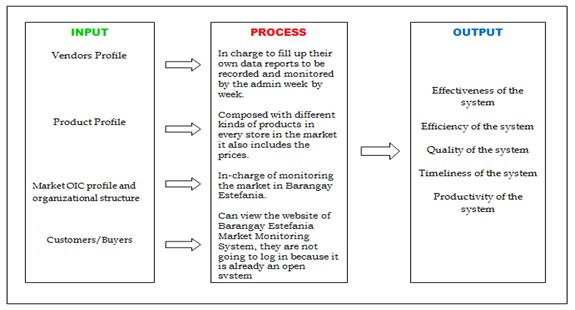
Figure 1: Conceptual of Barangay Market Monitoring System
Scope and Delimitation of the Study
This section enumerates the scope covered by the study and its delimitation.
Scope
The study covers Barangay Market Monitoring System that focuses on the statistical or overall product demands for a specific period. Through this system, it will help the Barangay to identify increasing / decreasing price of the products in the market. They will also identify the stock reports by checking the stock inventory of their products. This will also benefit the market goers, as they will be able to monitor current market prices and market activities of Brgy. real-time. The Barangay is also the one who is going to give penalties to those vendors who already commits over due payments for the rental fee.
Delimitation
This study does not include the ff:
- Checking of the income of each store that is located inside the Barangay market.
- The system will prevent vendors from comparing product profile from each other’s.
- Barangay is the one who is incharged on giving penalties to the vendors.
Significance of the Study
The result of this study will be beneficial to the following:
Barangay Officials To provide efficient and effective transactions through an organized system, with an authority of monitoring and securing the records of the market. This will also help manage and lessen the work and time of recordings. At the same time, this also aims to minimize the work of the Barangay kagawad who is encharged in monitoring the market system.
Vendors This system designed to aid vendors in marketing their products faster through website promotion in the barangay web portal. This will also save vendor’s list of products and prices in a database making it easy for them to monitor and edit their own pricing.
Customers This system will be beneficial to the customers in a way that it will be easy for them to compare current market prices and at the same time choose for themselves convenience in purchasing product in the market.
Proponent This system will enable them to apply what they have studied and researched.
Future Researcher This may provide basis to the future researchers who may experience a related system.
Definition of Terms
Monitoring. To watch, observe, listen to, or check (something) for a special purpose over a period of time.(“Merriam – Webster Dictionary”, n.d)
Database. Conceptually, is a collection of information that is organized so that it can easily be accessed, managed, and updated. (“Techtarget.com”, n.d)
BEMMS. As used in the study, this term refers to a system title. It is read as Barangay Market Monitoring System (BEMMS).
Operational. Fit for proper functioning; readyforuse.
System.As used in the study, this refers to a method of working or organizing all the transactions of the Barangay Market in terms of monitoring the product and prices in the market.
Review Of Related Literature
This chapter discusses the existing study into the context of proceeding related research. This research study cited articles and systems, which are pragmatic, are based on research and design of the developer to meet the user’s need.
Local Studies
Marketing Information Management System
The market keeps on changing and it is becoming a problem for some companies to cope with certain changes. The study aims to provide relevant information that will help decision makers formulate a better marketing mix specifically in the area of pricing and product. The study is achieved by developing a marketing information management system that initially acquires external and internal variables related to the chosen domain. These variables undergo various processes to produce feasible information that is later on used to manipulate plausible scenarios. Reasonable and realistic forecasting techniques are used to give the marketing users some insights. These insights
are used to come up with a possible strategic action on the underlying factors that influenced certainvariables, which are based on the assumptions that thesystem has provided. On the other hand, the manipulation of scenarios is not flexible, there are pre-defined scenarios that are manipulated in order for the marketing users to anticipate outcomes and possibilities of the said instances. As from what was deduced from the study and development the most appropriate methodologies the agile methodology. This is due to the fact that during the certain phases of the study and development, the information must be verified and validated before proceeding to the next phase. This is greatly
achieved in an agile approach wherein there is continuous data gathering, analysis, and testing. With the use of the information that is produced by the study and the developed system the users can come up with a better marketing mix for their product and price.
A Proposed Integrated Tourist Urban Market Center: Redevelopment of City of San Fernando Public Market in Pampanga
Transforming Public Market and its Environmental Systems through Micro and Green Urbanism
The gradual decline of local economic activity in the City of San Fernando, Pampanga is one of the many problems faced by the city. This activity is seen on their public market that has become one of the major trading centers in Central Luzon region before suddenly became unpopular to the public due to common problems and lack of facilities that could attract both locals and foreign nationals. In accordance with this problem, the author attempts to give the best solutions by investigating the existing public market, conducting interviews, reading various sources, formulating case studies and exploring new concepts and technologies. As the author eye to incorporate tourism as part of the development process then he proposes redevelopment of the existing public market together with tourist facilities such as furniture making unit with exhibition center, eatery plaza and a transportation terminal to revitalize the present condition of the public market. With these facilities, it will provide more job opportunities; preserve their local industries while strengthening their linkages to other economic centers in Central Luzon region.
Foreign Studies
Barcelona’s Public Market System
The unique public markets of Barcelona are poised for a thriving future based on their theoretical and empirical grounding and commitment to both global influences as well as the local traditions of trade and consumption. This global/local balance keeps the markets relevant to contemporary consumers and allows them to have a well-rounded experience as they shop. In this paper, I trace the history and previous incarnations of public markets through the Greeks, Romans and Arabs, as well as consider the European situation and its fluctuations over the centuries. I then uncover the debate surrounding globalization, its influence on the food system, and the technological and anthropological perspectives that inform future trajectories. Therefore, I analyze the role of globalization manifested through the goals of the IMMB and their current tactics, including creating supermarkets within the markets and creating and participating in international organizations. Similarly, I then examine the role of the IMMB and the community, primarily through the role of the products, the vendors, the consumers, and the markets social contributions. By probing the layers of the market system, it is possible to fully comprehend the drastic influence they have on the citizens, the city of Barcelona, as well as the other various cities and countries involved with the markets, thus understanding the importance of why concentrating on the markets today will help to ensure the dynamism of food consumption as well as a healthy city overall—economically, culturally, and socially—will continue to thrive into the future.
Real-Time Market Monitoring
The Department of Market Monitoring at California ISO is responsible for promoting robust, competitive and nondiscriminatory electric power market in California by keeping a close watch to efficiency and effectiveness of the ancillary service, congestion management and real-time spots market. We monitor the potential of the market participants to exercise market power and the market performance that results from the interaction of the market structure with participant behavior. In order to perform Monitoring activities effectively, DMM collects variable data, designs, and implement reporting dashboard that track key market metrics. We are using various SAS® BI tools to develop and employ metrics and analytical tools applicable to market structure, participant behavior, and market performance. This paper provides details about the effective use of various SAS BI tools to implement an automated real time market monitoring functionality
Related Systems
Table 1: Related System
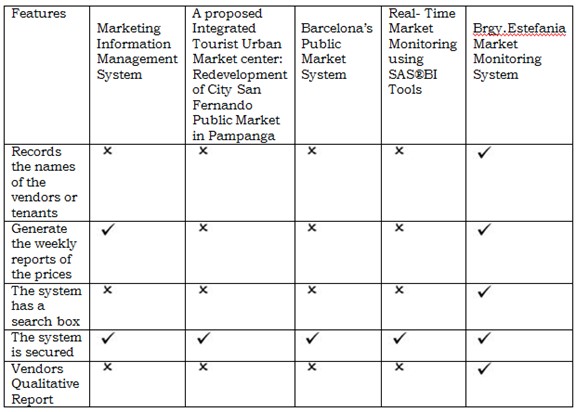
Table 1 shows features of the proposed system in the first column; where as the following columns are the features of the related systems.
Synthesis
The system that was presented were obtained from both foreign and local system study that were made basis for the developed of market monitoring system. It also describes some of features that are available on the system but some are not available with the local and foreign study.
Some of the features that is available in our system but not available with our related study. For recording the names of the vendor/tenant in local and foreign study they didn’t records the name, so in our proposed system we apply that the names of the vendors should be recorded. While in generating their weekly reports of the price only one local in related study are monitoring their weekly reports but in our system we should monitor their prices, and in our features we have a search box while in local and foreign don’t have, and for the vendors qualitative both the foreign and local don’t have, but in our system we have qualitative for us to know if the vendors report are good or bad.
In all the related system share similar nature to the study but we observed lack of recording the names of the vendor and generate weekly reports. That’s why in our proposed system we should prevent those upcoming problem to have a successful proposed project
Methodology
This chapter will discuss the flows and design of the system and on how the phases will go through. It discusses also the function and the detailed description of the different components of the system.
In this model, the stages have some connection, meaning that there are many tasks that happen concurrently. This model has a lot of advantage, it is flexible to correct mistakes, and can make changes that leads to less effort and time in working the project.
The system development process model is broken down into different phases. Basic phases of system development processes are as follows: requirement analysis, system design, testing, deployment and maintenance.
Requirement analysis
The researcher gathers the information of the data from the Barangay Kagawad of Barangay who was assigned in the market. Through the information that gathered, it figures out the solution for the manual process.
System Design
In the way of designing the system, the proponents decide to make a simple system that wills also a big tool to help the buyers to easily check the prices of a products. And can be easy for the barangay officials to monitor the market prices.
Testing
The researchers will invite the barangay official to test the system to determine the outcome of a system if it gives the correct operation that they needed. Moreover, they will rate the system as their feedback.
Deployment
In this phase, the system will be given to Barangay Market and deploy to the Barangay Officials for utilization purpose.
Maintenance
Every six months the system requires maintenance in order to keep its functionality on track and to deliver a great service for the customers.
A prototype is an early sample, model, or release of a product built to test concept or process or to act as a thing to be replicated or learned from. It is a term used in a variety of contexts, including semantics, design, electronics, and software programming.
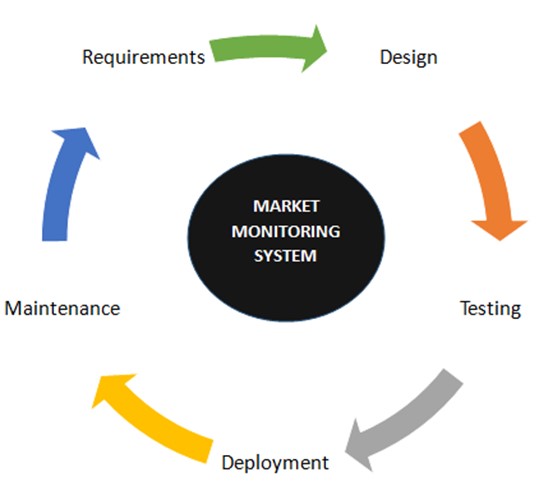
Figure 2: Prototyping Model
Technical Feasibility
Hardware Requirements
Server and Client
- Hard disk: 1 Terabyte or higher
- Memory: 4GB
- Processor: Core i3 or higher
- Monitor
- Mouse
- Keyboard
- Network: Gigabit Lan Card
Software Specifications
Server/Client
- Operating System: Windows 7 or Latest
- Browser: Firefox, Google Chrome, Opera
- Xampp: 3.5 version (Apache, MySQL)
Program Environment
Front End
HTML (Hypertext Markup Language)
HTML is the standard markup language for creating web pages and web applications. HTML can also embed programs written in a scripting language such as JavaScript, which affect the behavior and content of web pages.
CSS (Cascading Sheet Style)
CSS is a style sheet language used for describing the presentation of a document written in markup language. CSS is designed primarily to enable the separation of presentation and content, including aspects such as the layout, colors, and fonts. This separation can improve content accessibility, provide more flexibility and control in the specification of presentation characteristics, enable multiple HTML pages to share formatting by specifying the relevant CSS in the separate .css file, and reduce complexity and repetition in the structural content.
JavaScript
JavaScript often abbreviated as JS, is a high-level dynamic, weakly typed, prototype-based, multi-paradigm and interpreted programming language alongside HTML and CSS, JavaScript is one of the three core technologies of World Wide Web content production. It is used to make web pages interactive and provide online programs. The majority of websites employ it and all modern web browsers support it without the need for plug-ins by means of a built-in JavaScript engine. Each of many JavaScript engines represent a different implementation of JavaScript, all based on the ECMA script specification with some engines not supporting the spec fully and with many engine supporting additional features beyond (ECMA) European Computer Manufacturers Association.
PHP (Hypertext Preprocessor)
PHP is a server side scripting language designed for web development but also used as a general –purpose-programming language. Originally created by Rasmus Lerdof in 1994, the PHP reference implementation is now produced by the PHP group. Wikipedia PHP can be embedded into HTML.
Back End
JQuery
JQuery is a cross-platform JavaScript library designed to simplify the client-side scripting of HTML. It is free open-source software using the permissive MIT License. Web analysis indicates that it is the most widely deployed JavaScript library by a large margin. It also provides capabilities for developers to create plug-ins on top of the JavaScript library. This enables developers to create abstraction for low-level interaction and animation, advanced effects and high-level theme able widgets. The modular approach to the JQuery library allows the creation of powerful dynamic web pages and web application.
Architectural Diagram
Figure 3. Display the structural design of the system wherein the admin and vendors can log in with their different accounts. The admin has all the access in the system list add, edit, and delete. The vendors can view their products using their accounts. The buyers can view the different products in the system if they want to know what the cheapest product is sold in the market.
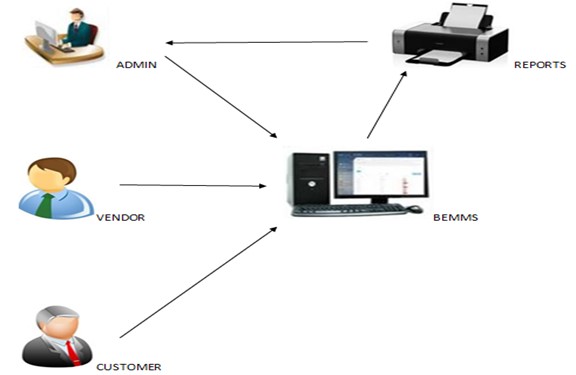
Figure 3: System Architecture
Feasibility Schedule
The feasibility schedule contains the record of the amount of time the proponents spent on the system
Gantt Chart
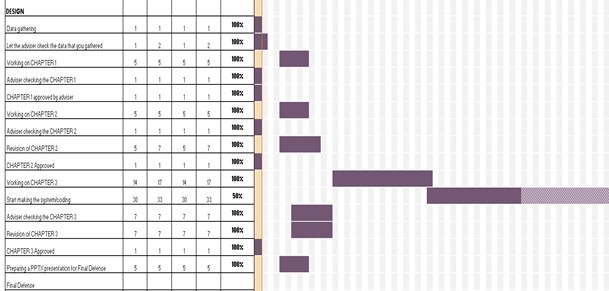
The following tables show the Gantt chart of the tasks that have been done by the proponents with the time allotted for the establishment of the entire system.
Table 2.0: Requirement Phase
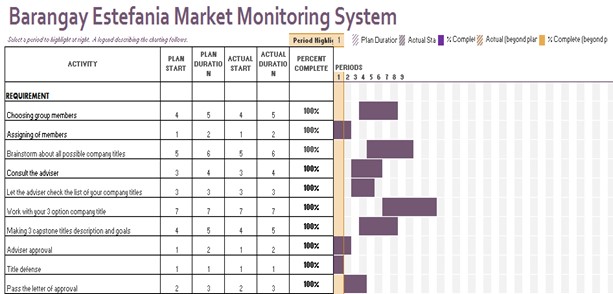
Table 2.1: Design Phase
Cost Benefit Analysis
Table 3.0 Developmental Cost
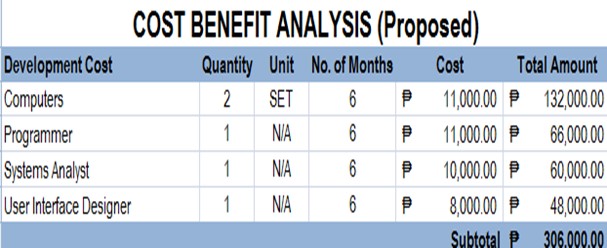
Cost Benefit Analysis or the CBA is the estimated cost and sum of the amount cost and benefits of the system, to determine whether the barangay market can gain benefit from the system.
Table 3.1 Operational Cost
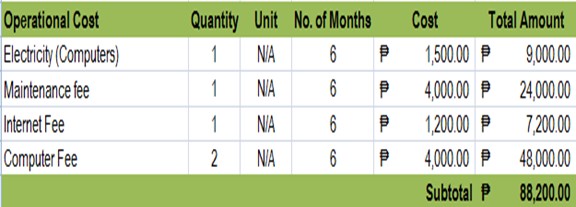
This table shows the Operational Cost of the researched system. The operational cost includes the maintenance cost and expenditures in using the researched system.
Table 3.2 Total Development Cost
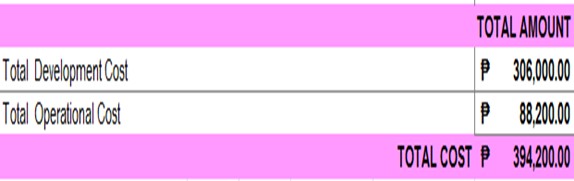
This table shows the total amount of developmental and operational cost of the researched system.
Table 3.3 Benefits of the System
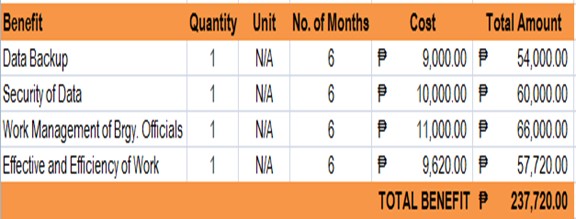
This table shows the computed benefits of the researched system to the company. The proponents have researched on what are the presumed amounts or value of each item that will benefit the barangay market over its traditional method per year.
Cost Benefit Analysis
Table 3.4: Cost Benefit Analysis
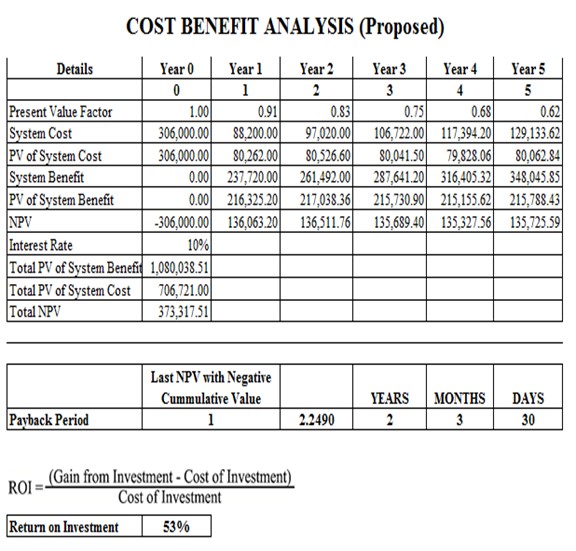
Table 2.4, shows a chart of the Cost and Benefits analysis. The Return of Investment comes out of 53%. The Payback Period was computed by taking the sum of the Present Value of system Benefit
(Php 216.325.20) subtracting it to the Present Value of System Cost
(Php 80,262.00) to get its Net Present Value and get the sum of Net Present Value (Php 136,063.20) subtracting it to the negative value of System cost (Php -306,000.00), and dividing the difference Net Present Value (Php 136,063.20). Resulting to 2.2490 which is round to 2, making it a 2-year payback period. Payback period = Initial Investment/Cash Inflow. The ROI was computed by taking the sum of the Total Present Value of system benefits (Php 1,080,038.51), subtracting it to the Total Present Value of System Cost (Php 706,721.00), and dividing the difference Total Present Value of System Cost (Php 706,721.00). The quotient is Php 1,080,038.51 which is equivalent to 53% of ROI or Return of Investment. The formula that the proponents used can be seen on Table 3.4.
Use Case Diagram
Figure 4. Shows the activity of the admin and the authorized personnel in the system. The admin can access all the transactions that the system provides. Register users have the privilege to view the system. Buyers also have the authority to scan the transactions in the system.
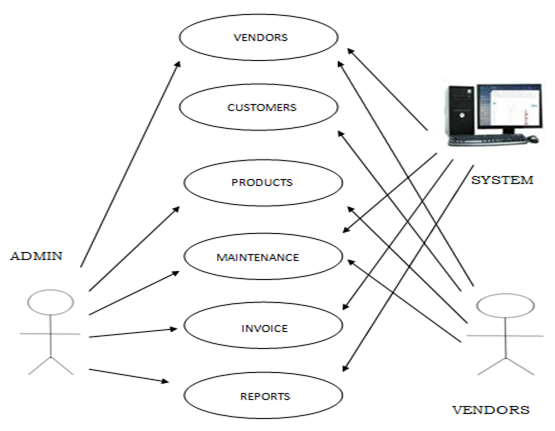
Figure 4. Use Case Diagram of Barangay Market Monitoring System
Data Flow Diagram
The flow of the system begins when the admin logs in and view the products and pricing of the vendors. Next is for the vendor to log in their username and password then they can view their products and pricing and they can also add, edit and delete. For the customer they can view the different products posted on different stores in the barangay market and its prices, and because of that they can compare the different prices of different products. Then it will go in a statistical information, the admin will generate and process the system maintenance.
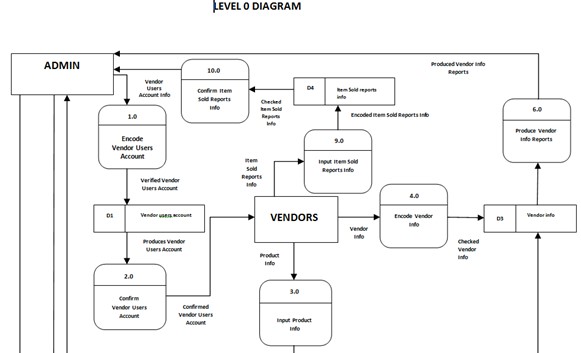
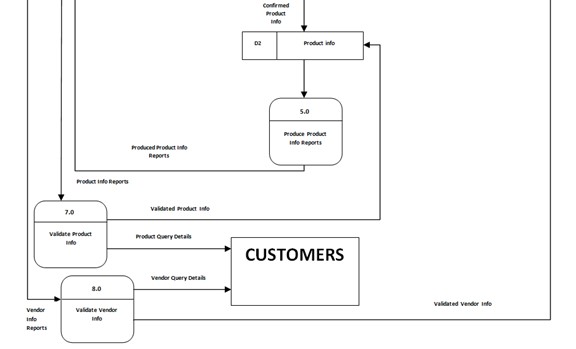
Figure 5: Data Flow Diagram of Barangay Market Monitoring System.
Database Dictionary
Table 4.0: Admin Table
| Tbl_admin | ||||
| Field Name | Data Type | Field Length | Constrain | Definition |
| Id | Int | 15 | Primary Key | Unique identifier of admin-table |
| Username | Varchar | 100 | Not Null | Username of the admin |
| Password | Varchar | 100 | Not Null | Password of the admin |
Table 4.1: Vendor Table
| Tbl_vendor | ||||
| Field Name | Data Type | Field Length | Constrain | Definition |
| Id | Int | 15 | Primary Key | Unique identifier of vendor-table |
| Username | Varchar | 100 | Not Null | Username of the vendor |
| Password | Varchar | 100 | Not Null | Password of the vendor |
| Phone | Int | 15 | Not Null | Contact Number of the Vendor |
Table 4.2: Products Table
| Tbl_products | ||||
| Field Name | Data Type | Field Length | Constrain | Definition |
| Veges id | int | 50 | Foreign Key | Unique identifier of veges-table |
| Seafoods id | Int | 50 | Foreign Key | Unique identifier of seafoods table |
| Pork id | int | 50 | Foreign Key | Unique identifier of pork-table |
| Rice id | Int | 50 | Foreign Key | Unique identifier of rice-table |
| Chicken id | Int | 50 | Foreign Key | Unique identifier of chicken-table |
Table 4.3: Veges Table
| Veges | ||||
| Field Name | Data Type | Field Length | Constrain | Definition |
| Id | int | 10 | Primary Key | Unique identifier of veges-table |
| Price | int | 100 | Not Null | Price of veges |
Table 4.4: Seafoods Table
| Veges | ||||
| Field Name | Data Type | Field Length | Constrain | Definition |
| Id | int | 10 | Primary Key | Unique identifier of seafoods table |
| Price | int | 100 | Not Null | Price of seafoods |
Table 4.5: Pork Table
| Pork | ||||
| Field Name | Data Type | Field Length | Constrain | Definition |
| Id | int | 10 | Primary Key | Unique identifier of pork-table |
| Price | int | 100 | Not Null | Price of pork |
Table 4.6: Rice Table
| Rice | ||||
| Field Name | Data Type | Field Length | Constrain | Definition |
| Id | int | 10 | Primary Key | Unique identifier of rice-table |
| Price | int | 100 | Not Null | Price of rice |
Table 4.7: Chicken Table
| Chicken | ||||
| Field Name | Data Type | Field Length | Constrain | Definition |
| Id | int | 10 | Primary Key | Unique identifier of chicken-table |
| Price | int | 100 | Not Null | Price of chicken |
Database Model
Entity Relationship Diagram
Entity Relationship Diagram explains every relationship between table’s entity and attributes. Each table has a definition that connects every table, both its primary key and foreign key. Use foreign key if the attributes of the one table have a unique id and foreign key will be identified when the other attributes are in the other table. Each attributes connects in performing every process.
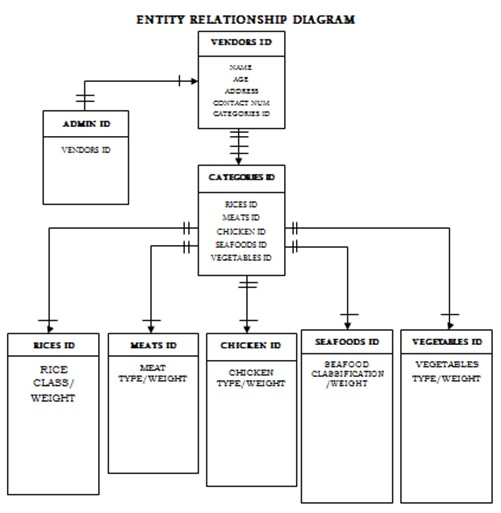
Figure 6: Entity Relationship Diagram
Presentation, Analysis And Interpretation Of Data
This chapter exhibits the results of the User’s Survey conducted for the system to the Barangay Estefania’s Barangay secretary and barangay market personnels.
Presentation
The team demonstrates the system’s functionality to the randomly selected respondents. The team observed the respondents on how they response to the system. The respondents evaluated using the User Acceptance Survey in order for the respondents to distinguish the level of acceptability of the proposed system.
Data Analysis
This section presents the analysis of the data collected and gathered from the respondents of Barangay Administration, market personnels and the Barangay personnel.
Characteristics of the Respondents
Table 5.0: Frequency of Respondents
| Respondents | Frequency |
| Barangay Admin Officer IV | 1 |
| Barangay Point Officer | 1 |
| Barangay Tanod | 9 |
| Barangay Market Personnels | 15 |
| Barangay personnel | 34 |
| Total | 60 |
The population composed of the Barangay Administration and personnel. The proponents got sixty respondents from the administration, market personnels and the barangay personnel.
Table 5.0 shows the number of respondents who have answered the User-Acceptability Survey. The researchers got a total number of 60 respondents.
Reliability Testing
The data collected by the proponents have undertaken reliability testing an acceptable approach through using the Yamanes Formula in order.
Yamanes Formula:
n = Sample size
N = Population size
e = level of precision 0.05 % (5%)
Solution:
This solution explains the summation of getting the sample size (n) of the population that will be taking the user acceptance survey. Where N=60 divided by 1+60 multiplied by 0.0025 as (e) or the level of precision. As the proponents get the (e), it is divided to 60 as the total population size (N). The result was 60 for the sample size of the population (n).
Interpretation of Data
Table 5.1: Interpretation of data
| Range Of Mean | Verbal Interpretation |
| 4.21-5.00 | Very Satisfied |
| 3.41-4.20 | Satisfied |
| 1.81-2.60 | Dissatisfied |
| 1.00-1.80 | Very Dissatisfied |
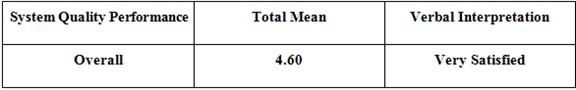
The instrument wished to access the perception of the users in terms of five (5) categories namely: Effectiveness, Efficiency, Quality, Timeliness and Productivity. The first category was composed of four (4) items, the second category was composed of three (3) items, and the third, fourth and last categories were composed of four (4) items. Table 5.6 shows that the user’s survey result for the system’s quality came back with a total mean of 4.600, which interpret, that the users were very satisfied with the system’s quality after testing it.
Effectiveness
Table 5.2: Survey Result – Effectiveness
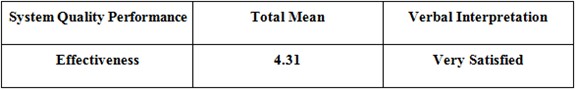
Table 5.2 shows that the user’s survey result for the effectiveness of the system came back with a total mean of 4.31, which interpret, that the users were very satisfied with the system’s effectiveness after testing it.
The respondents stated that the proposed system (BEMMS) meet the desired result and it produced the desired output. They also stated that the system is effective; it means it has an intended or expected outcome.
Efficiency
Table 5.3: Survey Result – Efficiency
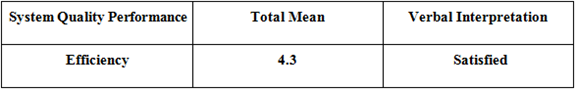
Table 5.3 shows that the user’s survey result for the system’s efficiency came back with a total mean of 4.3 which interpret that the users were satisfied with the efficiency of the system after testing it.
The respondents stated that the system (BEMMS), has the ability to avoid wasting energy, efforts, and time in generating and recording statistical reports. In a more general sense, the system (BEMMS), has the ability to do things well, and successfully.
Quality
Table 5.4: Survey Result – Quality
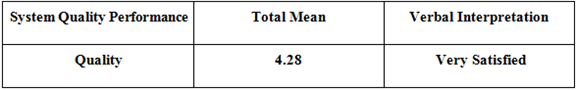
Table 5.4 shows that the user’s survey result for the system’s quality came back with a total mean of 4.28 which interpret that the users were very satisfied with the system’s quality after testing it.
The respondents stated that the system (BEMMS), meet the standards and expected outcome of the users in terms of its degree of excellence and very qualified after testing it.
Timeliness
Table 5.5: Survey Result – Timeliness
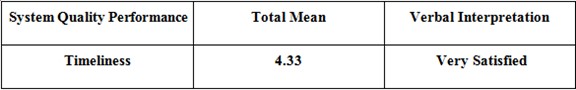
Table 5.5 shows that the user’s survey result for the system’s quality came back with a total mean of 4.33 which interpret that the users were very satisfied with the system’s quality after testing it.
The respondents stated that the system (BEMMS), has the quality in generating and recording statistical reports in well timed or useful time.
Productivity
Table 5.6: Survey Result – Productivity
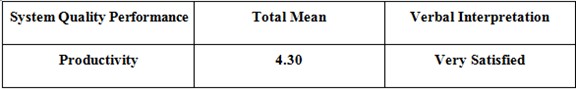
Table 5.6 shows that the user’s survey result for the system’s quality came back with a total mean of 4.30 which interpret that the users were very satisfied with the system’s quality after testing it.
The respondents stated that the system (BEMMS) has the ability to produce a desired result. They check the inventory outcome and the process of recordings input.
System Satisfaction
Table 5.7: Survey Result – System Satisfaction
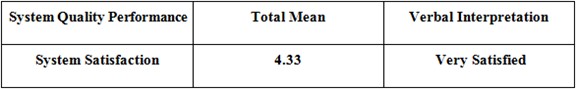
Table 5.7 shows that the user’s survey result for the system’s satisfaction came back with a total mean of 4.60, which interpret, that the we provide what is required the users were very satisfied with the system’s excellence after testing it.
Over All
Table 5.8: Survey Result – Over All
Summary Of Findings, Conclusions And Recommendations
This chapter presents the summary of the findings, and the conclusions and the recommendations for the system study.
Summary of Findings
This study was conducted for the purpose of designing an automated market monitoring system for Barangay Estefania, to have a faster, efficient, and effective records of prices and products. The descriptive method of research was employ. And the survey technique was used for gathering of information in the market.
The proponents conducted a survey to the employees of the barangay. There were 60 personnel’s in the barangay; one is the barangay captain, 10 in the Barangay officials, 15 in the market personnel’s and 34 in the community. The survey was conducted after the system had all the requirements, functionalities and features embedded.
The findings suggested that on the level of the user’s experience in terms of effectiveness of the system a mean score of 4.25 was obtained, interpreted as “satisfied”. As to the experience of the user in the efficiency category, it obtained a mean of 4.30, it interpreted “very satisfied”. On its system quality category, the users, it raked a mean of 4.35 interpreted as “very satisfied”. On timeliness category, the users gave a mean of 4.31 interpreted as “very satisfied”. On productivity category the user gave a mean of 4.35 interpreted as “very satisfied”. In overall, the systems rating is collected a mean of 4.60 is interpreted as “very satisfied” rating.
Conclusion
The proponents conclude that the system is operational, as of the sum data gathered. This condition is on the premise that it has addressed the necessary automation requirement of the firm after the thorough system study.
Recommendations
As the proponents had made an market monitoring system for the barangay, the system shall have maintenance for every 6 months to maintain and update its functions and a also for the security of its databases.
Leave A Comment
You must be logged in to post a comment.