Web Based Barangay Information System Capstone Project Document
Introduction
Information Technology along side Scientific and Technological innovations has been developing in a way which practically controls wealth and power of a nation. These technological innovations are actually achieved with the aim of human welfare. In fact 80% of the rural community people of third world countries do not get any fruit of these innovations achieved at the expense of billion of dollars. To the tune of only 20% of the people living in and around urban areas are utilizing the benefits of such developments. Modern information technology has transformed into a source of development raw materials, wealth and power of a nation are directed for the well-being of humanity. The modern and the new information technologies side by side with scientific and technological innovations have greatly influenced the chronological development of mode of information resource centers and technology development (Faruque et al., 2014).
According to Lado et al., (2017) computerized barangay information system is appropriate for use of barangay employees, who have access to profile of barangay residents for the direct reports. Moreover, departmental organizational staffs which have a business need for this information for their business unit can also benefit. This is responsible for an effective and efficient approach for barangay employees and residents. It well help them accomplish task faster and would also eliminate the need of a large staff. It will provide profile-based information for residents.
According to Rambaldi et al., (1998) resource mapping allows community members to identify, locate, and classify resource occurrence, distribution, use, tenure, and access. Critical locations such as areas known for illegal fishing, pollution, and siltation, among others are identified and mapped. The resource map is an essential input for planning and monitoring and evaluation purposes.
Malita, as the scope of this project is the capital municipality of the Province of Davao Occidental, Philippines. According to the 2015 Philippine Census, Malita has a Population of 117,746 people. The municipality is the main economic center of Davao Occidental province, agriculture and fishery are the main industries of the municipality. The current system being used by municipal personnel in gathering data of household, population and commodities is the survey process in which they need to transport in different barangays of Malita and then manually evaluate.
Thus, the developers proposed Web-Based Barangay Information System that will automate the management of barangay household, commodities, population, and establish geotagging of products and goods for barangays. It will utilize Google Map Application Programming Interface (API) to locate the commodities available per barangay.
Objectives of the Study
Generally, the system aimed to establish a Web-Based Information System of the barangays in Malita, Davao Occidental.
Specifically, it aimed to:
- Automate the management of barangay household, commodities and population;
- Populate barangay data to be viewed in municipal webpage in order to monitor the increase and decrease of households, commodities and population for an immediate action; and
- Establish geotagging of commodities for barangays which will utilize Google Map Application Programming Interface (API) for Malita, Davao Occidental, to locate the commodities in each barangay.
Significance of the Study
The study was designed for the Municipality of Malita, Davao Occidental. The implementation of this study is useful for appending benefits of the users. The administrator was regarded as an important user who can access the entire system and monitor the data being saved. Through the portal, municipality was updated and more aware of barangay situations in terms of household, commodities and population. They can also organize programs that can help the barangays. Furthermore, it provided information assistance for community growth and development.
The barangay personnel could efficiently implement the benefits to their constituents. Through this study, the community will efficiently receive any local government benefits that could give alternative solutions to the problems of community to maintain productivity.
Scope and Limitation of the Study
This system was designed for the Municipality of Malita, Davao Occidental and its barangays. It was limited to access by the administrator, municipal personnel and barangay personnel. The study covers only the household, commodities, population and geotagging. The household contains the resident’s profile. In addition, the system can count the total households and population. The system populates barangay data to be viewed in municipal webpage in order to monitor the increase and decrease of households, commodities and population for an immediate solution, and using the barangay coordinates which to be manage by the administrator and the commodity information from the barangay was used to utilize the geotagging of commodities.
Definition of Terms
Administrator – the one who has a control in the entire system
Artifacts – refers to the database and web application software component that runs in a server
Barangay Coordinates – refers to the latitude and longitude of barangay which used during the geotagging
Barangay Personnel – the one who are responsible in updating the household and commodities information
Commodities – one of the required data for geotagging procedure
Constituents – refers to the residents within the community they provide the data from the households
Database – refers to a storage of data to be retrieved during the runtime process of the system
Geotagging – refers to the procedure of combining the barangay coordinates and commodities and locate it to the map.
Households – thru this data, the system can count the total population
Municipal Personnel – the one who is responsible in populating data from the barangays
Nodes – refers to the web server hardware component exist in the system
Pre–installed – refers to the applications that was already available in a computer
Portal – a way to access the system, update and monitor the data that the study needed
Population – the total count per person in every barangay
Security – refers to the method use to secure the database of the system and also include password encryption.
Users – refers to persons who will used the system they are the administrator, municipal personnel and barangay personnel
Review Of Related Literature And Studies
GIS Application for Local Government Revenue
Fiscal decentralization – the devolution of revenue mobilization and spending powers to lower levels of government – has become a main theme of local governance in recent years (Fjeldstad 2005). Local revenue mobilization has the potential to foster political and administrative accountability by empowering communities (Shah 1998). Many local government areas are financially weak and rely on financial transfers and assistance from the central government (Brosio 2000). Moreover, the revenue collection administrations are often inefficient and large amounts of revenues are left uncollected whiles that collected are sometimes inappropriately managed (Fjeldstad 2005). If the local governments are able to generate a lot of revenue internally some of the funds can be used to undertake development projects in their respective assemblies instead of relying solely on the Central Government. There is therefore the need to improve the Internal Revenue Mobilization in order to meet targets set.
Geographic Information System (GIS) and Information Technologies (IT) have become effective tools for the administration of a decentralized government and for the mobilization and management of resources all over the world. They provide the framework for all forms of spatial data storage, data retrieval, and analysis, display, reporting and modeling (Jensen 2002).
Survey of Information Technology Use for Municipal Infrastructure Management
As municipalities increasingly rely on computer-based systems and data management, information that was traditionally exchanged through human communications can now be exchanged electronically through computer-to-computer data exchange. This requires much more formal specifications and agreements to govern these data exchanges (Zeb et al., 2012). Computer-based information retrieval operates through the use of software that can offer information services for an institution or organization. It is powerful and convenient builder for simultaneous growth in society and industries. An information service provides a way to electronically access, retrieve, and transmit that information (Imus et al., 2018).
Municipal Information Systems: Current Practices and Issues
Interesting and creative uses of IT in municipalities has been under-reported as there has been a major emphasis on for-profit entities. System integration, GIS, and other applications of IT create challenges and opportunities that seem unique to local governments. With the new GASB 34 that mandates state and local government information reporting, smart and creative IT application in critical. We discuss these points and our observations from interviewing the IT managers from some local governments (Olsen et al., 2010). As in business, leaders and management in government recognize that investment in IT for the sake of technology is not wise. Rather, they are concerned about acquiring systems that work well with one another. Particularly in areas like law enforcement and emergency services, integration of current stand-alone systems is a top priority (Black 2008).
Management Information in Rural Area
Communication activities are mainly described as delivering, deploying and improving relevant information presented to public. Information submitted by information provider needs to be understood by the public so that what information provider means can be accepted and implemented. Recommended media is providing digital media communication that is public information boards combined with web-based applications as a means of announcing information managed by the administrator, as well as the SMS gateway as a means of receiving feedback and information requests from the public. The information can be delivered in the form of information about education, health, agriculture, religious activities (Salim 2013).
The indigenous languages should be used for radio and television news to enable rural dwellers understand the message better since study has shown that many rural people cannot read or write; that modern and traditional information acquisition and dissemination channels should be used by information agent working in the rural areas; that further study should be carried out to discover the best acceptable channels to each categories of rural people (Ifukor 2013).
Technical Background
Technicality of the Study
The web-based Barangay Information System runs using a web browser. The system requires a computer that has operating system that is compatible with the Barangay Information System web page. Thus the system requires internet connection to utilize the Google map for viewing and geotagging of commodities in barangay. Moreover, it requires properly trained users to avoid unorganized data, incorrect information and system malfunction.
Details of the Technologies Used
Sublime Text 3 was used as the editor to perform and execute all the necessary functions that was needed during the development of the system. WAMP server was used for testing off-line preview of webpages to get idea how the webpage looks and it allows the developer to used computer as a local server. Google Chrome was also used as a web browser to load and run the contents of a web based system.
How the System Works
Data gathering and registering new and old data was used to developed a Web-Based Barangay Information System for Malita, Davao Occidental. To access the system, every portal of the system has its own unique username and password the barangay, municipal and administrator. If the system was log-in as barangay, it can manage household, and commodity data to be viewed in municipal web page. If the system was log-in as municipality, it can populate the household, and population information using a tabular form. In populating the commodity information was done using a tabular form and graphical view. Lastly, if the system was log in as administrator, it can manage all transaction done in the system.
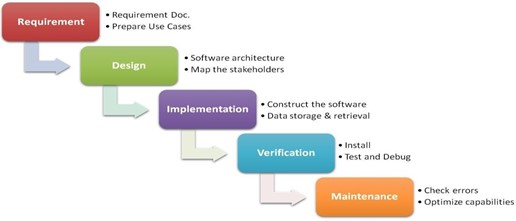
Figure 1. Waterfall Model
The developers used Waterfall Model as shown in Figure 1 in developing the system. First, the developers conducted interview to the municipal and barangay personnel if there was any problems occurs in information sharing between barangay and municipality. The developers gathered data from the municipal personnel, and the said data was the result during the conducted survey in the barangay, however, there were times the evaluated data was incorrect.
The developers decided to design the system in a web-based platform. Using a web-based system, transferring of data in a short period of time was possible since it only needs an internet connection to access the system. In implementing the system, the developers used the Pre-processor Hypertext Protocol (PHP) as its development language, Sublime Text as code editor and WAMP Server as Database Management System (DBMS).
Methodology
Research Locale
The system was conducted in the Municipality of Malita, Davao Occidental. The geographical coordinates of the deployment and coverage of the system are 6 °20’59.99” N latitude and 125 °31’59.99”E longitude.
Figure 2. Vicinity Map of Malita, Davao Occidental
Population of the Study
The population of the study was composed of various users, specifically the barangay personnel, municipal personnel and administrator to update the necessary information that the study needed. The barangay personnel has the task to manage the data from the barangay including resident’s profile. While the municipal personnel manages the data that was given by the barangay to be viewed in the municipal web page.
Operational Feasibility
The administration, municipal personnel, barangay secretary, support the project. The current system was effectively used, the users saw the need for change for improvements of data gathering and evaluation to
provide efficient services in the Malita community. The new system requires training for users to avoid incorrect information, and if some bugs occur they would know how to fix it. The administration of Malita was prepared to provide necessary resources for training current employees.
The involvement of users in planning the system from the start was not attained due to the conflict of schedule of the users and the researchers, yet the researchers were able to involve the users in the system. The constituents of Malita can experience disturbance temporarily in a way which they are involved in gathering data of household.
There are some legal issues that needs to be considered from the National Privacy Commission, which is the Implementing Rules and Regulations of Republic Act No. 10173, known as the Data Privacy Act of 2012, Section 2. Policy. These rules further enforce the Data Privacy Act and adopt generally accepted international principles and standards for personal data protection. To meet one of the objectives in this study it requires personal data of the residents in Malita. The developers need to consider the Data Privacy Act to ensure that personal data in information and communication are secured and protected to avoid any mischievous acts.
Figure 3 shows the breakdown of function and processes into lower level in the system. The diagram illustrates that the administrator has the
full access of the system. Were the barangay and municipality was under the administrator as well as its functions.
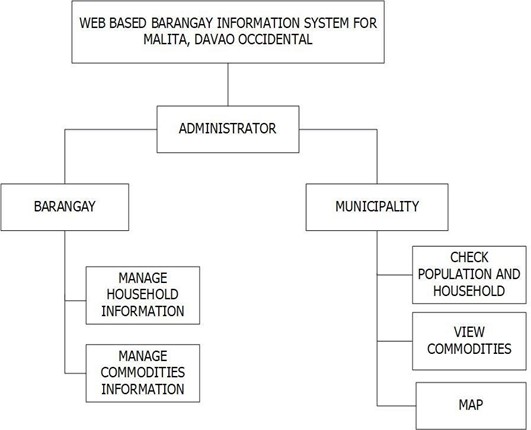
Figure 3. Functional Decomposition Diagram
Technical Feasibility
The municipality have necessary equipment that can support the system these are computers installed with browsers and internet connection. To avoid improper information, the developers recommend
having a technical expert to maintain the functionality of the system. The availability of required resources such as manpower, programmers, testers and debuggers was insufficient since the administration of Malita was still adapting the new technologies. Proper maintenance of hardware and software was highly required to maintain the reliability of the system were it could integrate other municipality information system to be more productive either now or in the future.
Compatibility Checking
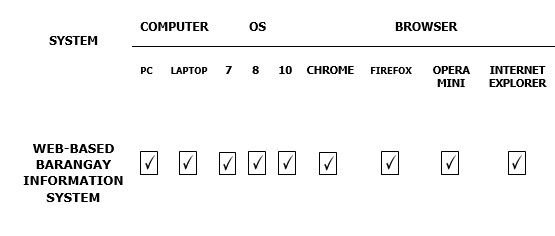
Compatibility checking was done by using the pre-installed browser for the computers available in the municipal hall and different barangay’s in Malita, Davao Occidental. The table 1 shows that the system was able to run in different windows operating system. The developers also check that the system was also able to execute at any internet browser since it was developed under open source programming language. The developers believed that the system can also run in any operating system as long as web server is present.
Table 1. Result of compatibility checking
Relevance of the Technology
The Barangay Information System was relevant to different barangays as well as to the municipality of Malita, Davao Occidental. It provides efficient information to municipality regarding population, households and commodities of barangay. The municipal personnel no need to travel into different barangay just to gather the information needed. It also helps the community of Malita to maintain the productivity by monitoring the quantity of commodities using a map to easily locate the barangay. The system was relevant to the current trend in the technology
since it was developed in a web-based system.
Schedule Feasibility
The developers used schedule in making the system. It follows time frame with different task to be completed. With the used of this chart, the developers carefully analyse and determine the important tasks for the system and future improvement and attainment its objectives.
Figure 4 shows the development time of the system from the beginning of the data gathering by means of interviewing the target users of the system to its submission period. With this instrument the developers supervise time and can give intervention to improve the system. The data gathering was done from June 2017 up to the first week of October 2017. The database design was done from last week of September 2017 to December 2017. System building was from November 2017 up to first week of March 2018. Initial Graphical User Interface (GUI) done from February 2018 to March 2018, testing of the system from last week of March 2018 up to first week of May 2018. The finalization of the system was done from April 2018 to May 2018. The documentation of the study started December 2017 and it was successfully finalized on May 2018 as well as the development of the system.
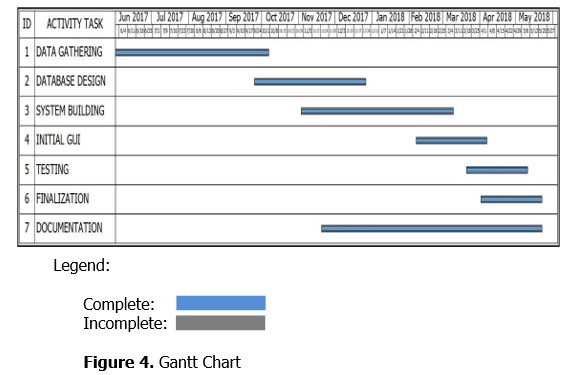
Figure 4. Gantt Chart
Economic Feasibility
The economic feasibility was determined by identifying costs and benefits associated with the system. The users can understood the financial opportunities and risk of the project. Were the administration of Malita have limited capital resources and multiple projects was competing for funds.
Cost and Benefit of the Project
The developers set the cost of the system aligned to the expenditures during the development of the system. Table 2 shows the development cost of the system which total amount of Php19,000.00. Table 3 shows the projected annual with a total of Php6,000.00 and the table 4 shows the projected annual gain a total of Php4,825.00.
Personnel
QTY PARTICULAR AMOUNT
2 System’s Programmer/Builder ( 300Hrs @ 50/hr) Php15,000.00
Sub-total 15,000.00
Expenses
QTY PARTICULAR AMOUNT
2 Travel Expenses Php4,000.00
Sub-total 4,000.00
Total Development Cost
Php19,000.00
Table 3. Projected Annual Cost Personnel
QTY PARTICULAR AMOUNT
1 System Programmer (Maintenance)(30days @ 100/day)
Php6,000.00
Sub-Total 6,000.00
Total Projected Annual Cost Php6,000.00
Table 4. Projected Annual Gain
| QTY | PARTICULAR | AMOUNT | |
| 25 | Bond Paper (Short) (183/ream) | Php4,575.00 | |
| 50 | Plastic Folder (Short) (5 each) | Sub-total | 250.00
Php4,825.00 |
ROI = [GAINS/ (TOTAL DEV. COST + PA COST)] * 100%
= [4,825/ (19,000+ 6,000)] * 100%
= [4,825/ 25,000] * 100%
= 0.193 * 100%
ROI = 19.3%
The computation of Return of Investment (ROI) formula resulted to 19.3%. Therefore, the developers strongly recommended that the client should acquire the system since it is found beneficial for them. The ROI was used to determine if the proposed system has the average rate of return earned on the money invested in the system.
Data and Process Modelling
Figure 5 shows the data structure and designed. It describes the structure of an information processing program or other process with in the system. Input used to submit data to the computer to get processed information and the output is the systems response upon the process.
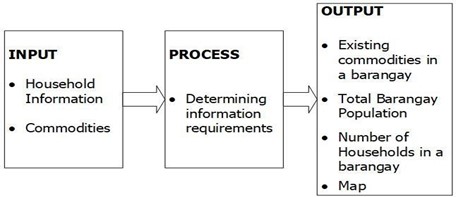
Figure 5. Input, Process, and Output Diagram of the System
Figure 6 shows the flow of the system. The system lets administrator input username and password if it’s registered direct to the dashboard. In the dashboard it loads all the module and operations of administrator in the system. The administrator has the authority to access the entire operations of the system.
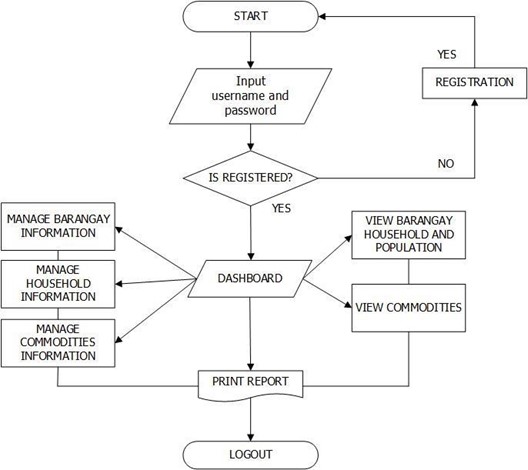
Figure 6. Administrator’s System Flow Chart
Figure 7 shows the Municipal Personnel flow of the system. The system validates the username and password by comparing the input username and password from the database, if it was verify, it check the user privilege then if municipal personnel has found, it loads the Municipal Personnel module and its operations within the system.
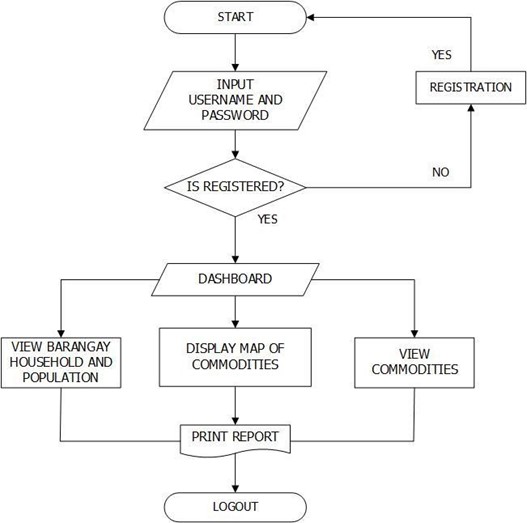
Figure 7. Municipal Personnel’s System Flow Chart
Figure 8 shows the Barangay Personnel flow of the system. The system lets the barangay personnel input username and password, it should be validated based on data from the database, it check the user privilege then if barangay personnel has found, it loads the Barangay Personnel module and the basic operation which are manage household information, manage commodities information and print reports.
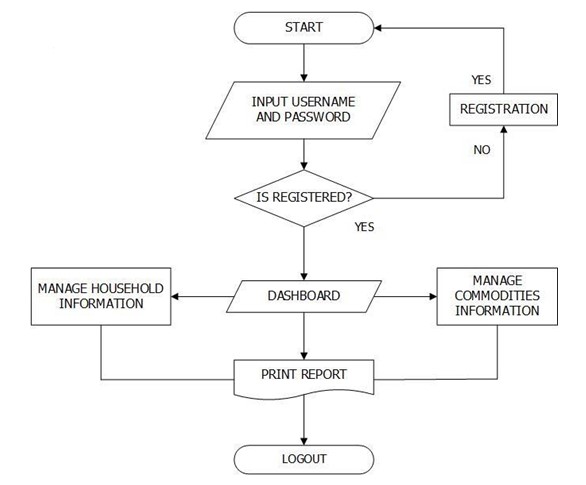
Figure 8. Barangay Personnel’s System Flow Chart
Figure 9 shows context diagram that defines the boundary of the system, its setting and objects that interact with it. It shows the individual that provides data into the system. The Barangay Information System processed commodities and household information of the barangay then, the system provide heat map of commodities which the data come from barangay. The Municipality can populate the data that was registered into the system.
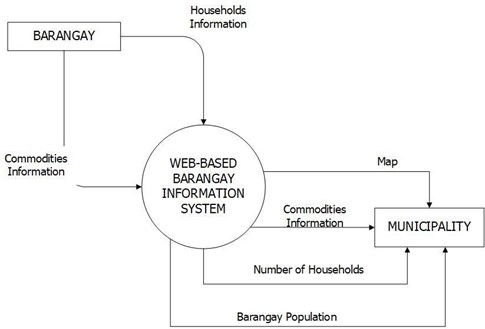
Figure 9. Context Diagram of the System
Figure 10 shows the data flows inside the system. This diagram was used to display the databases that can be found inside the system and the information being saved and retrieved during the runtime process of the system.
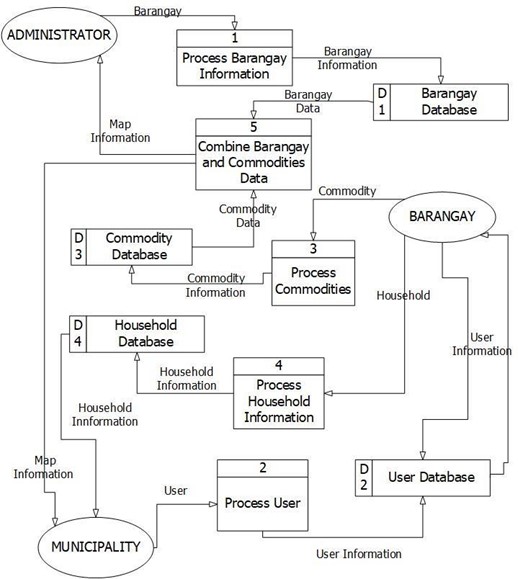
Figure 10. Data Flow Diagram of the System
Object Modelling
In understanding this system, figure 11 shows the use case diagram. This diagram shows the relationship of administrator, barangay personnel and municipal personnel actors of the system. It describes the flow of the system in different users. It describes a sequence of actions of the system that provides interaction to other actors of the system.
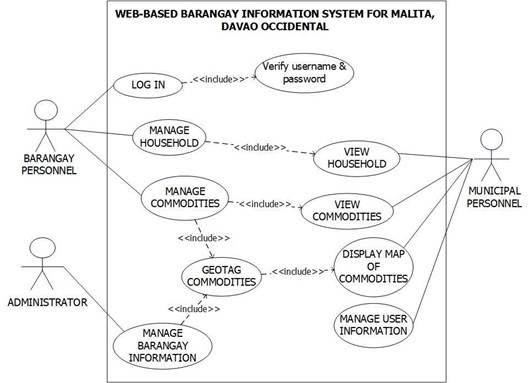
Figure 11. Use Case Diagram of the System
Figure 12 shows the relationship of different classes of the system. This diagram determines the process of and functions that was relevant to the system. Class diagram was used to describe the structure of the system by showing its classes, attributes and operations. It was generated from the Entity Relationship Diagram.
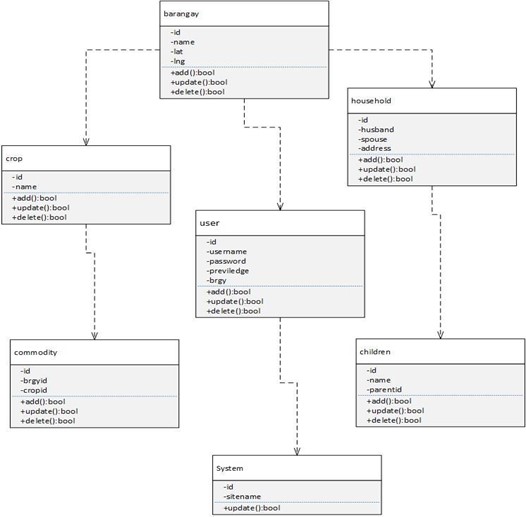
Figure 12. Class Diagram of the System
Figure 13 shows the collaboration of objects on a time sequence. The developers use this diagram to construct sequential chart. First, the system shows the login form then, the administrator provides username and password, if correct the administrator dashboard will show.
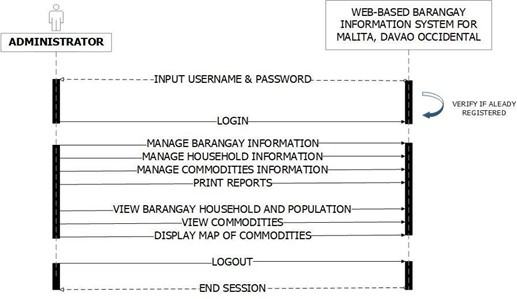
Figure 13. Administrator’s Sequence Diagram of the System
Figure 14 shows the collaboration of objects in Municipal Personnel time sequence in the system. It shows the operations of municipal personnel within the system. The municipal personnel can populate the information of the different barangays and provide reports.
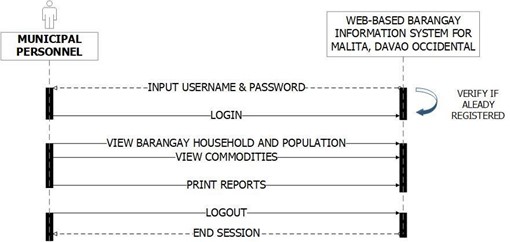
Figure 14. Municipal Personnel Sequence Diagram of the System
Figure 15 shows the sequence of objects in Barangay Personnel on the system. The system lets the barangay personnel input username and password, if it was verify that already registered then it successfully login. It loads the object sequentially done in the system.
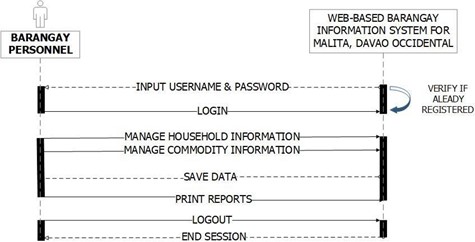
Figure 15. Barangay Sequence Diagram of the System
Figure 16 shows the administrator activities of the system. It describes the system in dynamic aspect. Activity diagram is also flowchart that represents activity to another activity. The activities below described administrator operation of the system.
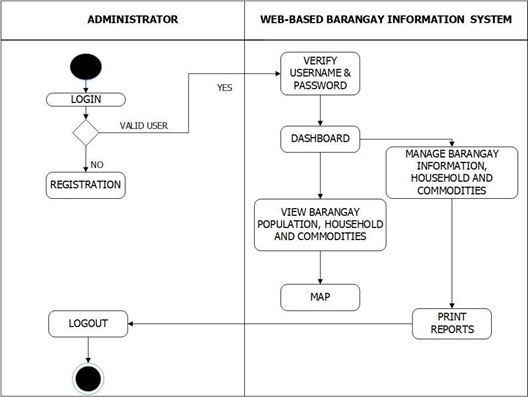
Figure 16. Administrator Activity Diagram of the System
Figure 17 shows the Municipal Personnel activities of the system. The municipal personnel start from login and the system verifies the username and password if it was valid direct to dashboard and if not redirect to registration. Under the dashboard shows the activities of the municipal personnel in the system.
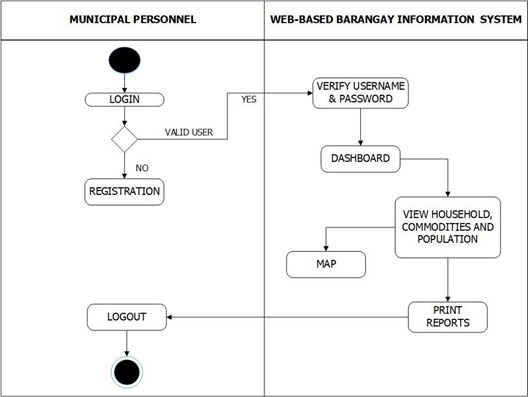
Figure 17. Municipal Personnel Activity Diagram of the System
Figure 18 shows the Barangay Personnel activities of the system. From the login, the system validates the username and password. If it was valid the dashboard load its activity which are manage household and commodities, it also contains print reports.
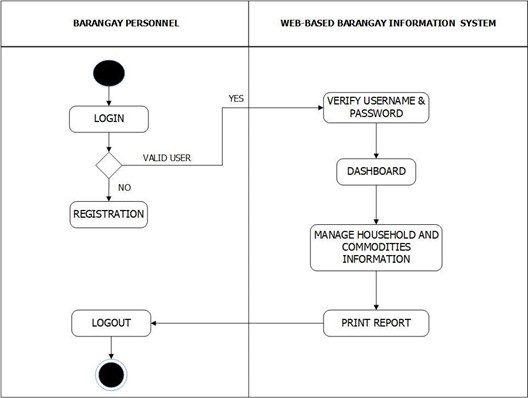
Figure 18.Barangay Personnel Activity Diagram of the System
Data Design
The entity relationship diagram was used to show the connection between various entity that was utilized and part of building this system. Figure 19 shows that there is one to many relation of the entity users, barangay, commodity, household and children. The system could have many users, and the users could be different barangays. The barangay have many households and different commodities, and one commodity could be in different barangay.
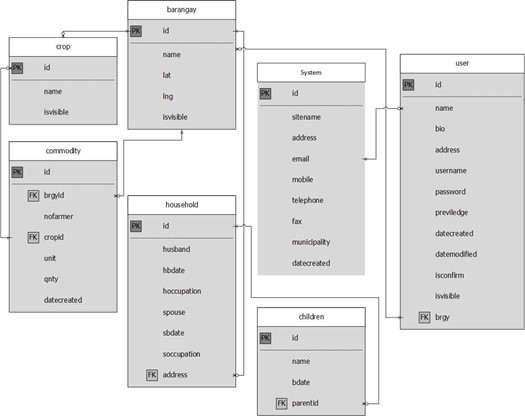
Figure 19. Entity Relationship Diagram of the System
Data Dictionary
Table 5 display data dictionary, it is an incorporated repository of data about in the barangay, commodity, crops, household, children, system and user. It also displays the attribute name, contents, data type, format, range, required, foreign key or primary key and foreign key reference table.
Table 5. Data Dictionary
| TABLE NAME | ATTRIBUTE NAME | CONTENTS | TYPE | FORMAT | REQUIRED | PK OR FK | FK REFFERENCE TABLE |
| barangay | Id Name Lat
Long IsVisible |
Baranga y ID Baranga y Name Baranga y Latitude Baranga y
Longitud e |
int(11)
varcha r (255) int(11) int(11) |
Xxxxx Xxxxx
Xxxxx Xxxxx |
Y Y Y
Y Y |
P K | |
| chlildre n | Id Name Bdate
parentId |
Children Id Children Name Children B-Date | int(11)
varcha r (255) Varcha r (255) int(11) |
Xxxxx x
Xxxxx x Xxxxx x |
Y Y
Y Y |
P K
F K |
|
| commodity | Id
Brgyid Nofarmer Cropid Unit Qnty datecreated |
Comm ID | int(11) | Y | P K | ||
| Brgy. ID No. of farmer
Crop id |
int(11) int(11)
int(11) |
Xxxxx x Xxxxx x | Y Y
Y |
F K | |||
| Comm unit Comm quantity Comm date | varcha r(255)
int(11) varcha r(255) |
Xxxxx x
Xxxxx x Xxxxx x |
Y Y Y | F K |
| Xxxxx x | |||||||
| crop | Id Name
isvisible |
Crop id Crop name | int(11) varcha r (255)
int(11) |
Xxxxx x Xxxxx
x |
Y Y
Y |
P K | |
| household | Id
Husband |
Househo
ld id Husband |
int(11)
varcha |
Xxxxx x | Y
Y |
P K | |
| name | r | Xxxxx | |||||
| Hbdate | Husband | (255) | x | Y | |||
| B-date | varcha | ||||||
| Hoccupati on | Husband occupati | r (255) | Xxxxx x | Y | |||
| Spouse | on
Spouse |
Varcha
r |
Xxxxx | Y | |||
| Sbdate | name Spouse | (255)
Varcha |
x | Y | |||
| B -date | r | Xxxxx | Y | ||||
| Soccupati on | Spouse occupati | (255)
Varcha |
x | Y | |||
| on | r | Xxxxx | |||||
| Address | address | (255) | x | ||||
| varcha | |||||||
| r | Xxxxx | ||||||
| (255) | x | ||||||
| varcha | |||||||
| r | Xxxxx | ||||||
| (255) | x | ||||||
| System | Id Sitename
Address Email Mobile |
System id System name Address
address Cell |
int(11) varcha r (255)
Varcha r (255) Varcha r |
Xxxxx x
Xxxxx x Xxxxx x |
Y Y
Y Y Y |
P K |
| Telephone | phone | (255) | Y | ||||
| number | Varcha | Xxxxx | |||||
| Fax | Telephon | r | x | Y | |||
| e | (255) | ||||||
| Municipalit | Number | Varcha | Xxxxx | Y | |||
| y | Fax | r | x | ||||
| datecreate | Number Municipa | (255)
Varcha |
Xxxxx | Y | |||
| d | l Name
Date |
r
(255) |
x | ||||
| created | Varcha r | Xxxxx x | |||||
| (255) | |||||||
| Varcha | Xxxxx | ||||||
| r | x | ||||||
| (255) | |||||||
| user | Id Name | User id User | int(11) varcha | Xxxxx | Y Y | P K
F K |
|
| name | r | x | |||||
| bio | User bio | (255)
Varcha |
Xxxxx | Y | |||
| Address | User | r (255) | x | Y | |||
| Username | address
Usernam |
Varcha
r |
Xxxxx
x |
Y | |||
| Password | e | (255) | Y | ||||
| Varcha | Xxxxx | ||||||
| Privilege | User | r | x | Y | |||
| passwor | (255) | ||||||
| Datecreated | d | Varcha | Xxxxx | Y | |||
| Datemodif | User privilege | r (255) | x | Y | |||
| ied | Date | Varcha | Xxxxx | ||||
| Isconfirm Isvisible | created Date | r (255) | x | Y Y | |||
| brgyid | modified
Is |
Varcha
r |
xxxxx
x |
Y | |||
| confirm | (255) | ||||||
| Is visible | Varcha | Xxxxx |
| Brgy id | r (255)
int(11) int(11) int(11) |
x
Xxxxx x Xxxxx x Xxxxx x |
Security
Using a case sensitive method in MySQL it traps font cases of the input username and password during login, were it must be the same as what was being registered. Eventough, municipal personnel can create user, yet the administrator has the authority to review and manipulate the users list if there was any malicious user being registered. Every barangay personnel and municipal personnel has its unique username and password to access the system. The security now a day was very important since hacking and intrusion was spread all over the web. Having antivirus protection was also important to protect computers from malicious software’s and data lost.
Software Specification
Software Specification it refers to the software used in developing a web-based Barangay Information System. It lays out the functionality of the system and includes the interaction of user that the software must provide. Table 6 shows the list of specific software being used in the system and its specification.
Table 6. List of software used
NAME OF SOFTWARE SPECIFICATION
Operating System Windows 10 64-bit
WAMP Server Version 2.4
Code Editor Sublime Text Version 3
Web Browser Google Chrome Version 66.0.3359.139 64-bit
Hardware Specification
Hardware specification refers to the system requirements where electronic components are recommended for the development of the system.
Table 7. List of hardware used
NAME OF HARDWARE SPECIFICATIONS
Desktop Computer
Internal Parts:
Central Processing Unit (CPU) 1.60GHz Random Access Memory (RAM) 4.00 GB Hard Disk Drive (HDD) 500 GB
Sound Card Built-in
External Parts:
Monitor 14 inches display LED
Keyboard Built-in
Mouse USB Type
Printer 3-in-1 inkjet printer
Ethernet Built-in
Programming Environment
PHP was used as the programming language of this system, combined with an array of site management tools. Sublime texts were used as the editor to perform and execute all the necessary functions that was needed during the development of the system.
WAMP was used for web development and internal testing, but may also be used to serve live websites. WAMP server was used for testing off-line preview of webpages to get idea how the webpage looks and it allows the developer to used computer as a local server.
Figure 20 models the physical deployment of artifacts on nodes. To describe a website a deployment diagram would show what hardware components (nodes) exist (e.g., a web server, an application server, and a database server), what software components (artifacts) run on each node (e.g., web application, database), and how the different pieces are connected (e.g. MySQL).
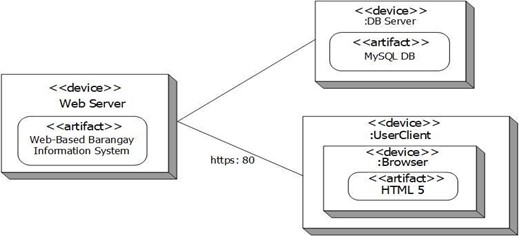
Figure 20. Deployment diagram of the system
Test Plan
Functional Testing is a testing type which is performed to verify that each functions, features, module of the system is working as per the given requirements by the client. Functional test is performed to confirm that the functionality of system is behaving as expected. Functional testing generates an output based on the given inputs and determines if the system is functioning correctly as per the specifications. Each functionality of the
system is tested by providing given set of inputs positive and negative reactions of the users, and edge values in order to know the actual behavior of the application and thereafter comparing with the expected results as per the given specifications. Figure 21 shows the steps in performing a functional testing.
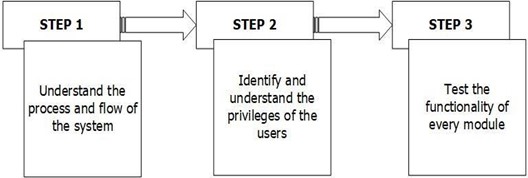
Figure 21. Functional Testing of the system
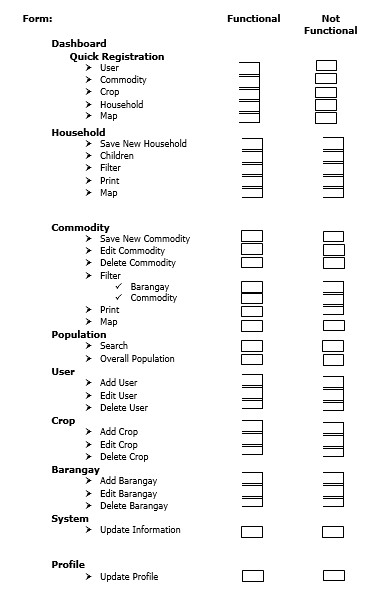
The table below shows the testing plan of the system. Table 8 includes all the module and operations in the system. It was also evaluated as functional or not functional.
Table 8. Test Plan
Summary, Conclusion And Recommendations
Summary
The study was conducted at Malita, Davao Occidental. The purpose of Web-Based Barangay Information System to help the community of Malita to maintain the productivity and efficient solutions from the local government if there was any problem occurs in population, households and commodities of every barangay. The developers used a waterfall method in developing the system. It is necessary to knew what was the problem occurs for them to evaluate the needed requirements for them able to design the system, how to implementation and test the system. The developers used PHP as the language for development, Sublime Text as the codes editor, WAMP Server to create a local server and Google Chrome as a web browser.
The project’s objectives was met, particularly, it could manage and gathered household, population and commodities data in a short period of time, and could now efficiently monitor the status of the community to provide an immediate solution and establish geotagging of commodities for
barangays which will utilize Google Map Application Programming Interface (API) for Malita, Davao Occidental, to easily find the commodities in which available barangay using map.
Conclusion
Base on the result of the study, the following conclusions were sought:
- A module that captures or store barangay information has been provided. Thus, there were two (2) ways in saving barangay information through administrator and barangay personnel;
- A module that populates barangay data was provided. The municipal personnel and administrator can populate data being save and can monitor its status; and
- A module that geotagged commodities was provided. With combination of barangay coordinates and commodities the system can provide a placemark with indication of its
Recommendations
The study was recommended to improve the barangay portal, that should include every sitio and purok. Furthermore, it was recommended to determine the exact address of the residents and categorize the population of every sitio within a barangay for further information. It was also recommended that the printed reports must contain header and footer, in order that the reports will be more presentable and formal.
Leave A Comment
You must be logged in to post a comment.