Faculty Loading System Capstone Project Document
Introduction
Teachers are the person who helps the students to acquire knowledge in school. Teachers or Faculties focuses on teaching the students on academic lessons. Every faculty has a workloads and schedules each school term.
Every semester, the Dean of is responsible to organize the section and subjects to create the load works of the faculty. Together with the program chair, they put enormous amount of effort to finish the task.
Manually organizing and preparing the loading of subjects to the teacher for the next semester is a task that consume a lot of time and effort to the administrator, that is why we come with this project that we know that can benefit our institution, the Faculty Loading System.
This system will manage the overloading of subjects of the faculty. This system can help the administrator in aiding the complicated faculty loading that is a very difficult task to be done in a short period. After the load works is finalized, the system can print copies of workloads of the faculty members immediately.
Background of the Study
Loading of subjects to the faculty members are manually organized by the Program chair and distributed to the Faculty members. The Room Scheduling and Faculty Loading System will help the Dean and Program chair prepares the schedule and load of the faculty members in a short period.
This study will resolve the problems involving the creating the load works of the faculty. In addition, can identify the overload of the faculty.
Objectives of the Study
The main objective of this study is to provide a system that allows preparation of Loading and Subject management for the CBMA.
- This study will design and develop a Faculty Loading System for that will:
- create a system that manages faculty loading and course subjects.
- monitor the load, number of preparations, designation and status of the teacher.
- generate a printed copy of Faculty Load.
2.Evaluate the system using ISO 9126 standard.
Conceptual Framework
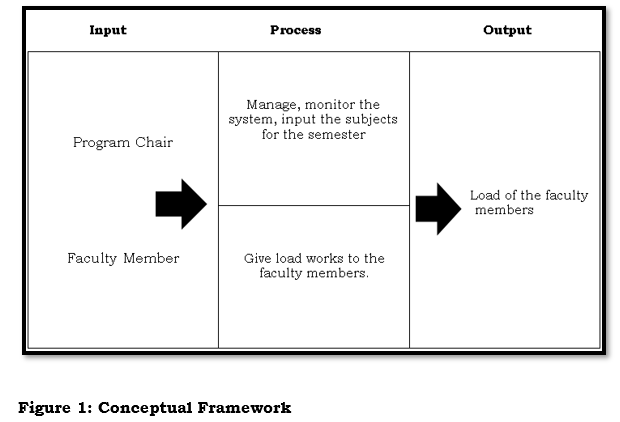
- The system will manage by the Program Chair. They will encode to the system the subjects released by the registrar for the next semester. The Program chair will assign the load works to the faculty member.
- The Faculty members will receive print out of the Load Work.
Scope and Delimitation of the Study
Scope:
The study covers only the Campus. The system can be accessed by the Program Chair. The system aims to minimize the time and effort of the Program Chair in making the load works of the teacher. The system can produce print out of load work and distribute to the teachers.
Delimitation:
This study is limited to the Program chair. Program chair is allowed to input the data to system, he/she has the sole authority to update the data inputted. Only the Program Chair is allowed to manage the work load of the faculty.
Significance of the Study
A system has its unique function and significance to the effectiveness and efficiency in the institution’s operation. The proponents developed a system for faculty loading which will help the school based on the system operation and functions.
There are various people who could benefit from the use of the system as in the case of the Dean, and the Department chair and the Teachers
College Administrator. This study is significant to the college administrator to create the list faculty loading without difficulty in a short period of time.
The Program Chair. This study is significant to the Program Chair in loading the prepared schedules for the teachers in a short period of time.
Faculty members. This study is significant to the Teachers in having a copy of their workload, they don’t need to write down, they just need to print a copy of their work load for the semester.
Future Researchers. This study is significant to the future researcher for educational purposes. And improve their data gathering skills.
Definition of Terms
Data
Conceptually, it is an information output by a sensing device or organ that includes both useful and irrelevant or redundant information and must be processed to be meaningful.
(https://www.merriam-webster.com/dictionary/data)
Operationally, it is a gathered information that is processed and stored in a computer.
Database
Conceptually, a usually large collection of data organized especially for rapid search and retrieval (as by a computer)
(https://www.merriam-webster.com/dictionary/database)
Operationally, the proponents use the database to collect data which it is arrange a Faculty Loading and Room Scheduling System in a computer.
Faculty Load
Conceptually, the faculty load report is a method of tracking teaching (credit courses) and non-teaching assignments of full-time and associate faculty throughout the college. (https://www.collin.edu/hr/hrcompensation/load_current.pdf)
Operationally, it is the workload of the faculties to organize or manage by the DEAN (as the administrator).
Local Area Network (LAN)
Conceptually, it is a computer network that interconnects computers within a limited area such as a residence, school, laboratory, university campus or office building and has its network equipment and interconnects locally managed.
(https://en.wikipedia.org/wiki/Local_area_network)
Operationally, it is a network of computer that interconnects from the Dean to the Program chair in the Carlos Hilado Memorial State College
Review of Related Literature
Local Study
De La Salle University Faculty Loading System
FLO (Faculty Loading Online) v3.0 is a web-based application that allows assignment of subjects and scheduling of non-teaching activities of all faculty members DLSU-D. The system is patterned after the Institutional Policies on Faculty Loading and assignment of non-teaching activities.
The data gathered in this system is used in the faculty (my.Sked, my.Advisee, my.E-class, my.Evaluation) and in the student (my.Class, my.E-Class) versions of the my.DLSU-D Portal. Moreover, the faculty loading used in the preparation of the Major Examination Schedules and in processing the data for the Student Evaluation to Faculty Members.
– Enrollment System
This system makes the transaction in the registrar’r office convenient, easier and faster for both students and the teachers. Students and teacher’ information are electronically storable, retrievable and can generate reports.
The system can view and print student information by course and year level; it can go specifically to a school year and view and print information; and, it has maintenance features that allow adding of departments and subjects, edit information on students data. Safety features, to avoid unauthorized access to file, through password was also integrated in the system. (Catong et. Al(2009))
Foreign Study
Faculty Workload System of Silpakorn University, Thailand
In a Thai public university, a faculty member has multiple duties besides teaching and researching, such as administrative work: the committee members in many faculty projects. The workload for a faculty member varies depends on the university policy, the faculty policy and the department policy. The target at the university policy being the research and teaching, a faculty member must concentrate on these tasks. However, the administrative work cannot be avoided and the workload depends on the number of people in the department. Each university has different ways to divide the workload. In the author’s university, the information on the work done on each type of job is split.
Thus, in this paper, the author describes the case on gathering the workload information and proposes to integrate the information which helps organize the workload for the whole department effectively. The author presents the developed information system which divides the overall workload based on existing information and views the workload for each faculty member, and department. They also discuss the integration issues to existing Management Information Systems in the university.
(Chantana Chantrapornhcha, 2012)
University of Washington Faculty Workload System
Faculty workload information is currently used at the department level course planning/scheduling decisions, estimating current and future staffing needs and determining curricular barriers to timely progress toward a degree. Higher administrative levels use FWS information for interaction with legislature and peer institution.
The project design required that information be gathered about weekly activities of university instructional faculty. That included time spent in actual classroom contact, class preparation, student advising, departmental research, administration, UW and public service, etc. Such data were solicited from every instructional faculty member for each quarter of 1993-94. There were significant faculty and departmental objection to the necessity for gathering such detailed information. It also required many additional resources, effort and burden on the university staff to gather such a huge amount of data. As a result, when the mandate was satisfied, the university decided to reduce data gathering to just those hours spent in direct in direct instructional contact with students. That model continues to the present.
Related System
Table 1 shows the features of the proposed system in the first column compared to the related systems in the succeeding columns.
Synthesis
The mentioned studies, De La Salle University Faculty Loading System, is a system that grants or allows assignment of subject loads and scheduling of non-teaching activities of all faculty members. It can organize the data gathered for the faculty loads and the schedules of the non-teaching activities.
For – Enrollment System it is a system that manages the enrollment process/flow, it also can generate a printed copy of the student’s enrollment information. It is related on the loads of subjects that a student can take based on the give course and section.
As for Faculty Workload System of Silpakorn University, Thailand, it allows the administrator to gather workload information and proposes to integrate the information, which helps organize the workload for the whole department. The administrator manages the workload information every school term, which divides the overall workload based on the existing information and views the workload for each faculty members and department.
The study of University of Washington Faculty Workload System, it is used to access course planning, identifying the curricular barriers and estimating the current and future staffing needs/requirements. This system gathers information about weekly activities of the faculty, which includes class preparation, examination, public services, etc.
Methodology
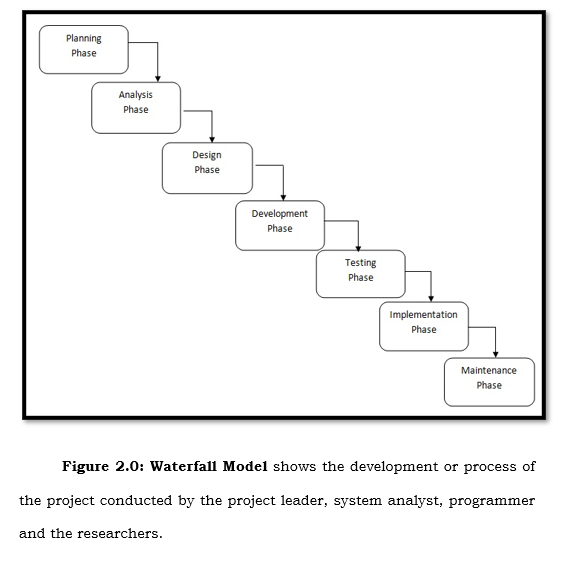
This chapter explains the process or method of the system according to the research projects. The researchers gathered information about the people in the institution that are related and significant on this study. It reviews the research problem or questions, the research procedure, and the research feedbacks of the study. The proponents use the waterfall model, which consists of 7 Phases such as Planning Phase, Analysis Phase, Design Phase, Development Phase, Testing Phase, Implementation Phase, and Maintenance Phase.
Waterfall Model
Planning Phase
In this phase, planning is the first step on developing or processing the proposed system or project. The proponents gathered data and information related to the proposed system to find out the possible problem. In addition, propose a system that should be develop to solve the problem, which is related from the study.
Analysis Phase
In this phase, the proponents conducted an interview from the Program Chair which is the one who manages the faculty loads. And gathered forms and information that are related from the proposed study.
Design Phase
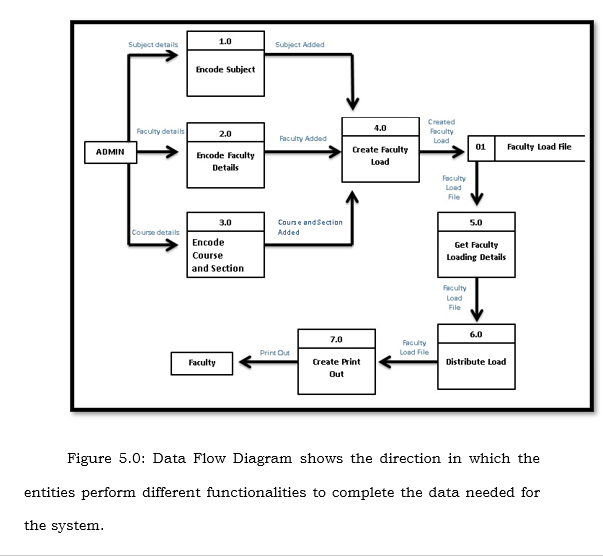
In this phase, the proponents make the prototype of the system by constructing the data flow diagram. We interview the dean and formulate a diagram that show how the system works.
Development Phase
In this phase, it involves the continuous developing the Faculty loading through the process of coding and documentation. The proponents constructed the system by using JavaScript, HTML, and MySQL. Moreover, used PHP on designing the structure of the system. The proponents used laptops and computers, with windows 7 OS and Sublime text to edit the text for HTML. PHP for server side scripting language, MYSQL for database and BOOTHSTRAP and CSS for the markup language.
Testing Phase
In this phase, the proponents tested the developed system if the system functions are properly correct. And debugging if there are any possible errors from the system.
Implementation Phase
After testing the system, the proponents will review the system if it is already prepared to perform the function of the developed system.
Maintenance Phase
In this phase, the proponents will improve the system by fixing the issues and maintaining the system to secure the functions.
User’s Acceptance Survey
This study undergoes the user acceptance testing conducted by our researcher. The researcher interviews the Program Chair for they will be the beneficiary of this study. We gathered data can help in creating the system that we are proposing.
Requirement Specification
Operational Feasibility
Based on the information gathered by the researchers, the is currently using manual method which is a harder process to do. The proposed system will improve the process and method that will minimize the time and effort put in creating the faculty load of the teacher.
The admin, which is the Program chair, is the one that will manage the system in creating the faculty loads.
Program Environment
Front End
The front end is the one responsible for collecting the input data from the user and then processing it so that it completes the request that the user has made. In this study, HTML and JavaScript serves as the scripting language of the user interface system. For the design of the system, the proponents used BOOTSTRAP and CSS codes.
Backend
The back end is the server-side of the system. In this study, the proponents used PHP for the server scripting language, which serves as the middle ware and the MySQL for the database.
Technical Feasibility
Hardware Requirement
Table 2.0: Hardware Requirements
| Specification | Recommended Requirement |
| Processor | 2.0 GHz or higher |
| Memory | 2GB RAM or higher |
| Printer | Any inkjet compatible printer |
| Hard Disk | 120 GHz or higher |
Software Requirement
Table 2.1: Software Requirements
| Specification | Recommended Requirement |
| Operating System | Windows 7, 8 and 10 |
| Front End | Html, CSS and Bootstrap |
| Back End | Apache and MySQL |
| Web Browser | Internet Explorer, Google and Mozilla Firefox |
| Server | MySQL |
| Web Server Package Tool | XAMPP |
System Architecture
Figure 3.0 illustrates how the system will flow. The Office of Registrar releases the subjects for the next semester and the ADMIN encodes it to the system. Program Chair will distribute the workload of the faculty to organize the schedule. Finally, print out is release to the Faculty Members.
Cost Benefit Analysis
Development Cost
Table 3.0: Development Cost
| Description | Duration | Monthly Cost | Total Price |
| Programmer | 5 months | Php5 000.00 | Php25, 000.00 |
| Electricity | 5 months | Php150.00 | Php750.00 |
| Laptop | Php20, 000.00 |
Total Development Cost: Php45, 750.00
Table 3.0 shows the development cost of the proposed system.
Operational Cost
Table 3.1: Operational Cost
| Operational Cost | Duration | Monthly Cost | Total Price |
| System unit | Php25, 000.00 | ||
| Electricity | 12 months | Php150.00 | Php1, 800.00 |
| Printer | Php4, 000.00 | ||
| Bond Paper | 12 months | Php165.00 | Php1,980.00 |
Total Operational Cost: Php32, 780.00
Table 3.1 shows the operational cost of the proposed system.
Total Development Cost: Php45, 750.00
Total Operational Cost: Php32, 780.00
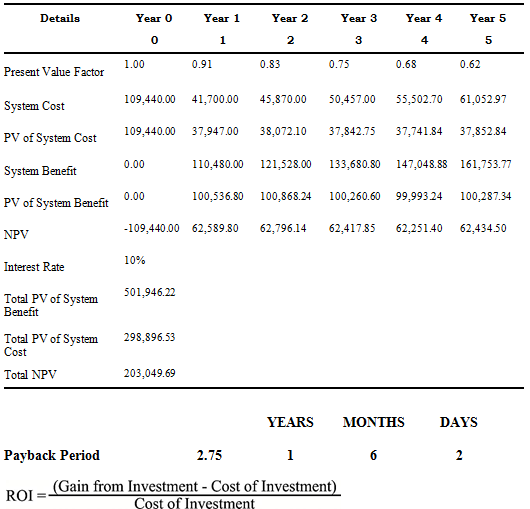
Total Cost: Php78, 530.00
Table 3.2: Benefits
| Item | Duration | Monthly Cost | Total Price |
| Bond Paper | 12 months | Php165.00 | Php1, 980.00 |
Total Benefits: Php1, 980.00
Table 3.2 shows the benefits of the proposed system.
Database Model
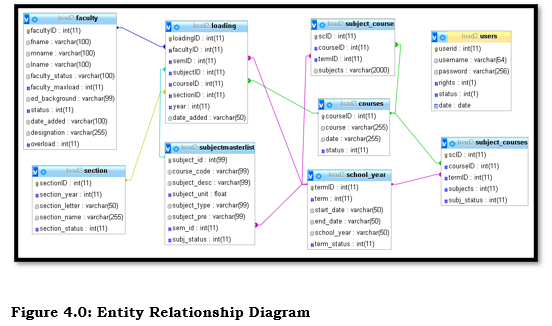
The figure 4.0 above illustrates the Entity Relation Diagram which shows the system’s entities and the relationships between those entities.
Data Flow Diagram
Gantt Chart
Data Dictionary
Table 4.0: Data Dictionary of the System
Table 4.1: courses
| Field Name
|
Constraints | Field Type | Length | Description |
| courseID | Primary key | Int | 11 | Represents the course id |
| course | varchar | 255 | Represent the
name of the course |
|
| date | varchar | 255 | Represent the date added | |
| status | int | 11 | Represent the status of the course |
Table 4.2: faculty
| Field Name
|
Constraints
|
Field Type
|
Length
|
Description
|
| facultyID | Primary key | int | 11 | Represent the faculty id |
| fname | varchar | 100 | Represent the first name of faculty member | |
| mname | varchar | 100 | Represent the middle name of the faculty member | |
| lname | varchar | 100 | Represent the last name of the faculty member | |
| faculty_status | varchar | 100 | Represent the status of the faculty | |
| faculty_maxload | int | 11 | Represent the amount of maximum load of the faculty | |
| ed_background | varchar | 100 | Represent the educational background of the faculty | |
| status | int | 11 | Represent the status of the faculty | |
| date_added | varchar | 100 | Represent the date added | |
| designation | varchar | 255 | Represent the designation of the faculty | |
| Overload | int | 11 | Represent the overload of the faculty |
Table 4.3: loading
| Field Name
|
Constraints
|
Field Type
|
Length
|
Description
|
| loadingID | Primary Key | Int | 11 | Represent the loading id |
| facultyID | Foreign Key | Int | 11 | Represent the faculty |
| semID | Foreign Key | int | 11 | Represent the sem id |
| subjectID | Foreign Key | int | 11 | Represent the subject id |
| courseID | Foreign Key | int | 11 | Represent the course id |
| secionID | Foreign Key | int | 11 | Represent the section id |
| year | int | 11 | Represent the year | |
| date_added | varchar | Represent the date added |
Table 4.4: school_year
| Field Name
|
Constraints
|
Field Type
|
Length
|
Description
|
| termID | Primary Key | int | 11 | Represent the term id |
| term | int | 11 | Represent the term | |
| start_date | varchar | 50 | Represent the starting date | |
| end_date | varchar | 50 | Represent the end of date | |
| school_year | varchar | 50 | Represent the school year | |
| term_status | int | 11 | Represent the term status |
Table 4.5: section
| Field Name
|
Constraints
|
Field Type
|
Length
|
Description
|
| sectionID | Primary Key | int | 11 | Represent the section id |
| section_year | int | 11 | Represent the year level of the section | |
| section_letter | varchar | 50 | Represent the section by letter | |
| section_name | varchar | 255 | Represent the section name | |
| section_status | int | 11 | Represent the section status |
Table 4.6: subject_course
| Field Name
|
Constraints
|
Field Type
|
Length
|
Description
|
| scID | Primary Key | int | 11 | Represent the subject course id |
| courseID | Foreign Key | int | 11 | Represent the course id |
| termID | Foreign Key | int | 11 | Represent the term id |
| subject | int | 11 | Represent the subject encoded |
Table 4.7: subject_courses
| Field Name
|
Constraints
|
Field Type
|
Length
|
Description
|
| scID | Primary Key | int | 11 | Represent the subject course id |
| courseID | Foreign Key | int | 11 | Represent the course id |
| termID | Foreign Key | int | 11 | Represent the term id |
| subject | int | 11 | Represent the subject encoded | |
| subject_status | int | 11 | Represent the status of the subject |
Table 4.8: subject_masterlist
| Field Name
|
Constraints
|
Field Type
|
Length
|
Description
|
| subject_id | Primary Key | int | 99 | Represent the subject course id |
| course_code | varchar | 99 | Represent the subject code | |
| subject_desc | varchar | 99 | Represent the subject description | |
| subject_unit | float | 99 | Represent the subject unit | |
| subject_type | varchar | 99 | Represent the type of subject | |
| subject_pre | varchar | 99 | Represent the pre requisite of the subject | |
| sem_id | Foreign Key | int | 11 | Represent the sem id |
| subj_status | int | 11 | Represent the status of the subject |
Table 4.9: users
| Field Name
|
Constraints
|
Field Type
|
Length
|
Description
|
| userid | Primary Key | int | 11 | Represent the user id |
| username | varchar | 64 | Represent the username | |
| password | varchar | 256 | Represent the password | |
| rights | int | 1 | Represent the rights to access to the system | |
| status | int | 1 | Represent the status of the users | |
| date | date | Represent the date when users created |
Presentation, Analysis, and Interpretation of Data
This chapter presents and interprets the results of the User’s Acceptance Survey in the system for – Faculty Loading System.
Presentations
The proponents select the respondents to be evaluated randomly and demonstrate the system based on their knowledge of interest in computers. The proponents evaluated them using the User Acceptance Survey questionnaire provided by the capstone adviser and gather the data in order to work on the statistical formulas afterwards.
Data Analysis
This section presents the analysis of the data collected from the respondents from the – Faculty Loading System faculty, members and some students.
Characteristics of Respondents
The population of this evaluation in regard to – Faculty Loading System is consisting the students and faculty members of the campus. The proponents have gathered 30 respondents inside the school area in regards of the system acceptability.
| Respondents | Frequency |
| Students | 25 |
| Faculty Members | 5 |
| Total | 30 |
Reliability Testing
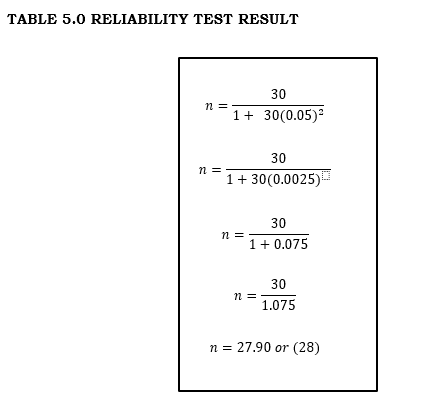
The data collected by the proponents have undergone reliability testing. An acceptable approach through using the Yamane’s Formula in order to identify the value of the sample size of population that will undergo the User Acceptance Survey.
n – The sample size
N – The population size
e – The acceptable sampling error
= 95% confidence level and p = 0.5 are assumed
This table shows the result of reliability testing undergone by the data gathered from the User-Acceptance Survey. The (n) stands for sample size, the (N) stands for total population size of respondents, has a value of 30. The acceptable sampling error has a value of 0.05 multiply by itself with a result of 0.0025. Then, the result of acceptable sampling error (0.0025) multiply by the population size (30) will result to 1.075. Therefore, the population size (n) has a value of 30 divided by 1.075 the total survey result is equivalent to 27.90
Interpretation of Data
The proponents of – Campus conducted an observation which evaluates the responses of the user in the current division of the faculty of the organization and some students to comply the required minimum responses. The instrument wished to access the perception of the users in terms of five (5) categories namely: Effectiveness, Efficiency, Quality, Timeliness, and Productivity, in each category consist of satisfactory levels that the respondents filled up for.
Table 6.0: Rating Scale
Range of Mean Verbal Interpretation
4.21 – 5.00 Very Satisfied
3.41 – 4.20 Satisfied
2.61 – 3.40 Neutral
1.81 – 2.60 Dissatisfied
1.00 – 1.80 Very Dissatisfied
This table shows the range of mean and its verbal interpretation.
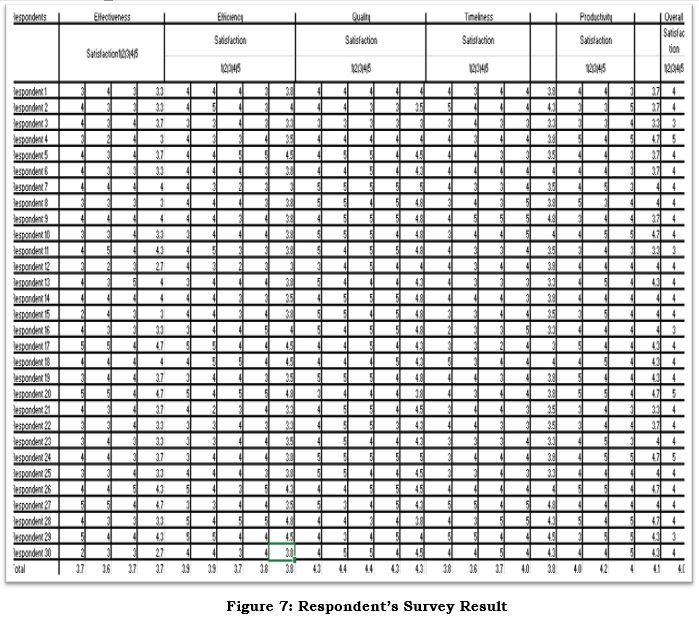
Figure 7 shows the result from the User’s Acceptance Survey wherein 30 respondents have been tested.
Table 7.0: Survey Result – Effectiveness
EFFECTIVENESS
Effectiveness
Question 1 Question 2 Question 3 TOTAL
Mean 3.7 3.6 3.7 3.7
Table 7.0 shows that the user’s survey result for the effectiveness of the system has a total mean of 3.7 which interprets that the users were satisfied with the systems effectiveness.
Table 7.1: Survey Result – Efficiency
EFFECIENCY
Efficiency
Question 1 Question 2 Question 3 Question 4 TOTAL
Mean 3.9 3.9 3.7 3.8 3.8
Table 7.1 shows that the user’s survey result for the efficiency of the system has a total mean of 3.8 which interprets that the users were satisfied with the systems efficiency of the system after testing it.
Table 7.2: Survey Result – Quality
QUALITY
Quality
Question 1 Question 2 Question 3 Question 4 TOTAL
Mean 4.3 4.4 4.4 4.3 4.3
Table 7.2 shows that the user’s survey result for the quality of the system has a total mean of 4.3 which interprets that the users were satisfied with the systems quality of the system after testing it.
Table 7.3: Survey Result – Timeliness
TIMELINESS
Question 1 Question 2 Question 3 Question 4 TOTAL
Mean 3.8 3.6 3.7 4 3.8
Table 7.3 shows that the user’s survey result for the quality of the system has a total mean of 3.8 which interprets that the users were neutral with the systems timeliness of the system after testing it.
Table 7.4: Survey Result – Productivity
PRODUCTIVITY
Question 1 Question 2 Question 3 TOTAL
Mean 4 4.2 4 4.1
Table 7.4 shows that the user’s survey result for the quality of the system has a total mean of 4.1 which interprets that the users were satisfied with the systems productivity of the system after testing it.
Based on the tables above, the result of the study’s User’s Survey is above average. There’s no rating below 1. Therefore, it attest that it is a good survey and it is a good system.
Summary of Findings, Conclusions and Recommendations
This chapter presents the summary of the system project, the findings of the study and the conclusion based on the findings. Recommendations are given as called for by the findings of the study.
Summary of Findings
The proponents conducted interviews to the organization to identify the main problem of the administration. After the evaluation and thorough research, the proponents started to create a system that would help the organization to manage the process of workloads.
– Faculty Loading System focus on organizing the loading of subjects for every semester or summer classes per school year, managing the workloads of the faculty members, also it can monitor the overloading subjects and update the profile of the teachers
The proponents conducted a user acceptance survey to analyze the acceptability of the users to the Faculty Loading System if it could get a good average rate when it comes to its system effectiveness, efficiency, quality, timeliness and productivity. As the result shown in Chapter 4, the system get an average rate of 4.
Conclusion
Based on the findings, data and feedback that was being gathered in the whole chapter, the proponents concluded that the system is useful to the organization because it can manage the load of the faculty and course subjects. It can monitor the load, designation, number of preparations and status of the faculty member. The system can generate printed copy of reports of subjects of the teacher. Hence, the system can manage by the administrator per semester or summer for every school year.
Recommendations
In the view of the findings and conclusions of the study, the proponents recommend the – the following:
- The organization must provide a high quality printer.
- Provide or upgrade hardware equipment (PC, server, etc.).
- Administrator must manage and secure the system properly.
- Develop the interface of the system to access the system more responsive.





Leave A Comment
You must be logged in to post a comment.